29
/
en
AIzaSyAYiBZKx7MnpbEhh9jyipgxe19OcubqV5w
April 1, 2024
47923
Middle East & North Africa
MEA
false
2
1
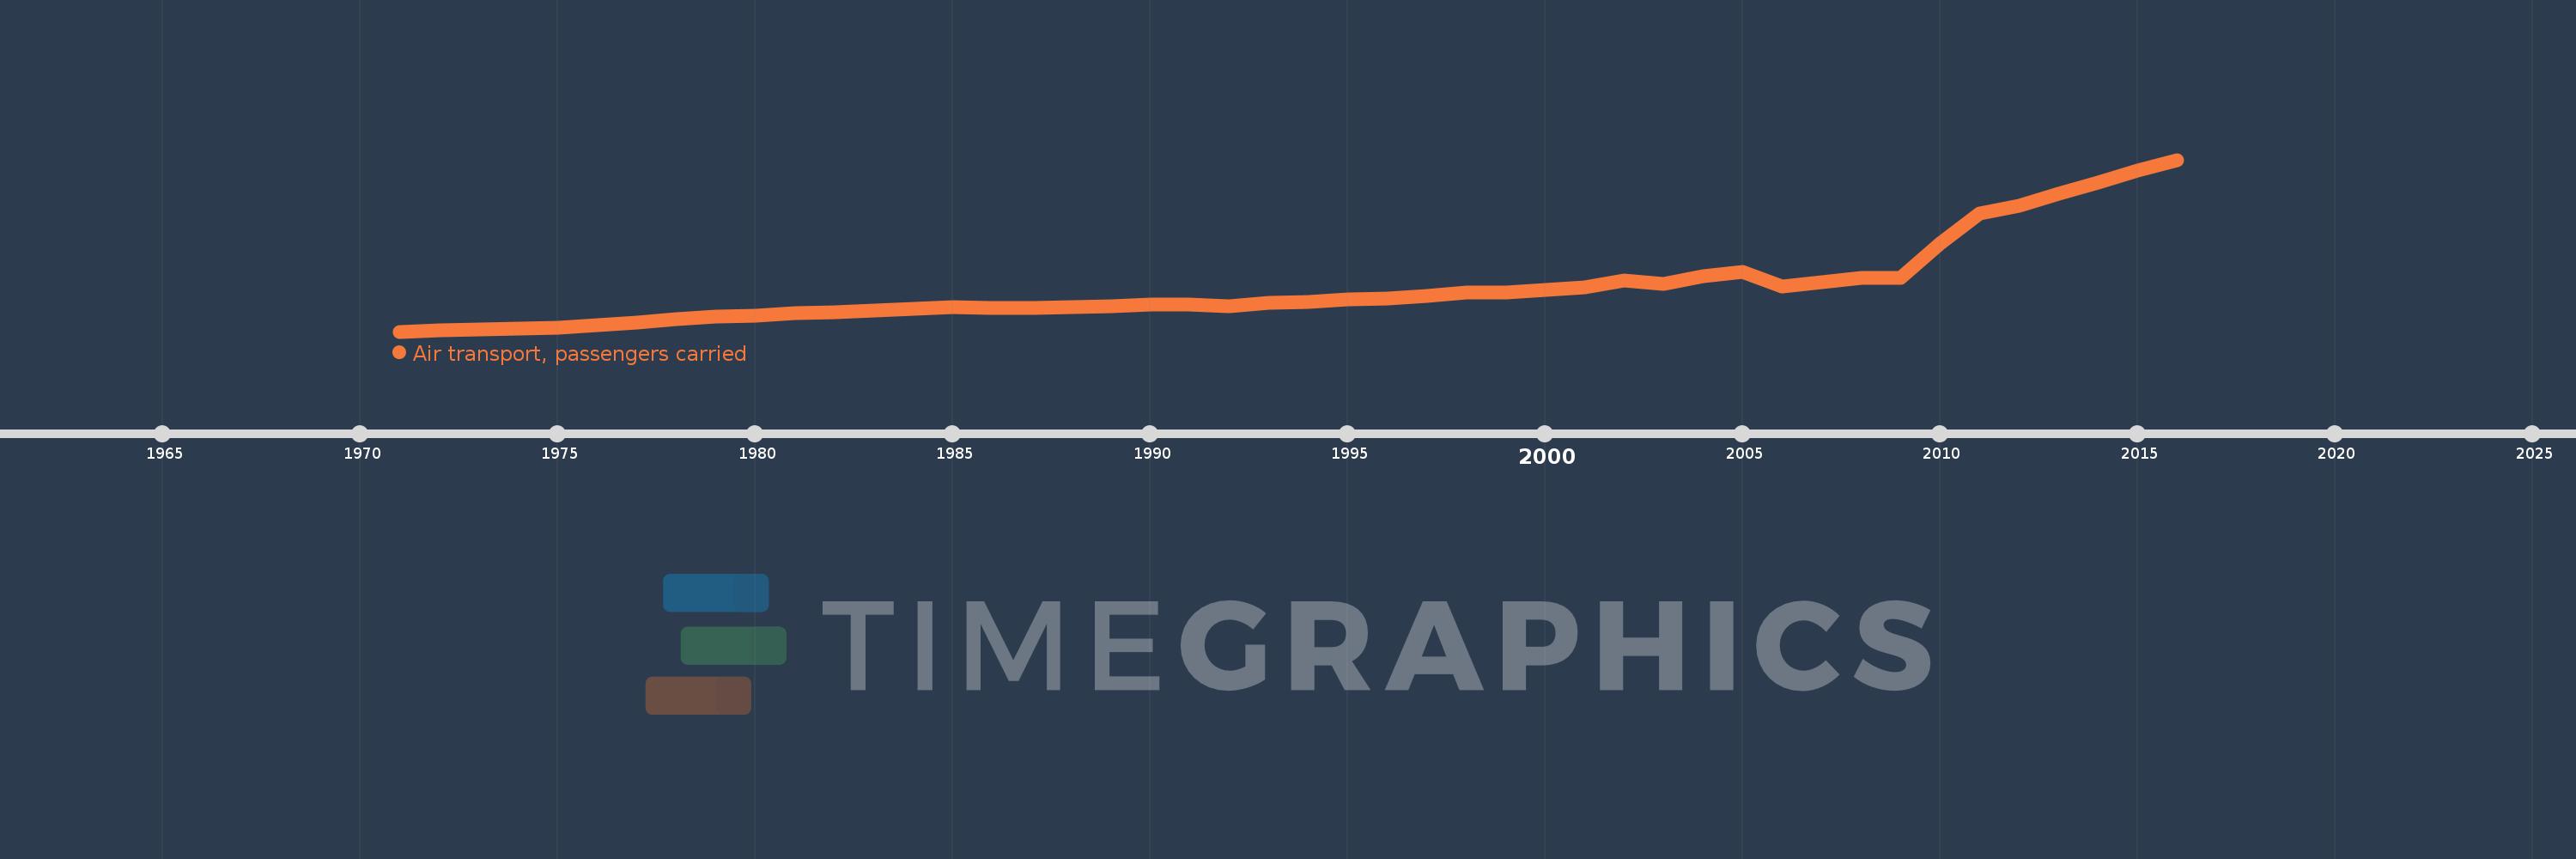
Air transport, passengers carried
2016,2015,2014,2013,2012,2011,2010,2009,2008,2007,2006,2005,2004,2003,2002,2001,2000,1999,1998,1997,1996,1995,1994,1993,1992,1991,1990,1989,1988,1987,1986,1985,1984,1983,1982,1981,1980,1979,1978,1977,1976,1975,1974,1973,1972,1971
This statistics in other country:
AfghanistanAlbaniaAlgeriaAmerican SamoaAngolaAntigua and BarbudaArab WorldArgentinaArmeniaAustraliaAustriaAzerbaijanBahamas, TheBahrainBangladeshBarbadosBelarusBelgiumBelizeBeninBhutanBoliviaBosnia and HerzegovinaBotswanaBrazilBrunei DarussalamBulgariaBurkina FasoBurundiCabo VerdeCambodiaCameroonCanadaCaribbean small statesCentral African RepublicCentral Europe and the BalticsChadChileChinaColombiaComorosCongo, Dem. Rep.Congo, Rep.Costa RicaCote d'IvoireCroatiaCubaCyprusCzech RepublicDenmarkDjiboutiDominican RepublicEarly-demographic dividendEast Asia & PacificEast Asia & Pacific (excluding high income)East Asia & Pacific (IDA & IBRD countries)EcuadorEgypt, Arab Rep.El SalvadorEquatorial GuineaEritreaEstoniaEthiopiaEuro areaEurope & Central AsiaEurope & Central Asia (excluding high income)Europe & Central Asia (IDA & IBRD countries)European UnionFijiFinlandFragile and conflict affected situationsFranceGabonGambia, TheGeorgiaGermanyGhanaGreeceGuamGuatemalaGuineaGuinea-BissauGuyanaHaitiHeavily indebted poor countries (HIPC)High incomeHondurasHong Kong SAR, ChinaHungaryIBRD onlyIcelandIDA & IBRD totalIDA blendIDA onlyIDA totalIndiaIndonesiaIran, Islamic Rep.IraqIrelandIsraelItalyJamaicaJapanJordanKazakhstanKenyaKiribatiKorea, Dem. People’s Rep.Korea, Rep.KuwaitKyrgyz RepublicLao PDRLate-demographic dividendLatin America & Caribbean Latin America & Caribbean (excluding high income)Latin America & the Caribbean (IDA & IBRD countries)LatviaLeast developed countries: UN classificationLebanonLesothoLiberiaLibyaLithuaniaLow & middle incomeLow incomeLower middle incomeLuxembourgMacao SAR, ChinaMacedonia, FYRMadagascarMalawiMalaysiaMaldivesMaliMaltaMarshall IslandsMauritaniaMauritiusMexicoMiddle East & North AfricaMiddle East & North Africa (excluding high income)Middle East & North Africa (IDA & IBRD countries)Middle incomeMoldovaMonacoMongoliaMontenegroMoroccoMozambiqueMyanmarNamibiaNauruNepalNetherlandsNew ZealandNicaraguaNigerNigeriaNorth AmericaNorwayOECD membersOmanOther small statesPacific island small statesPakistanPanamaPapua New GuineaParaguayPeruPhilippinesPolandPortugalPost-demographic dividendPre-demographic dividendQatarRomaniaRussian FederationRwandaSamoaSao Tome and PrincipeSaudi ArabiaSenegalSerbiaSeychellesSierra LeoneSingaporeSlovak RepublicSloveniaSmall statesSolomon IslandsSomaliaSouth AfricaSouth AsiaSouth Asia (IDA & IBRD)SpainSri LankaSub-Saharan Africa Sub-Saharan Africa (excluding high income)Sub-Saharan Africa (IDA & IBRD countries)SudanSurinameSwazilandSwedenSwitzerlandSyrian Arab RepublicTajikistanTanzaniaThailandTogoTongaTrinidad and TobagoTunisiaTurkeyTurkmenistanUgandaUkraineUnited Arab EmiratesUnited KingdomUnited StatesUpper middle incomeUruguayUzbekistanVanuatuVenezuela, RBVietnamWorldYemen, Rep.ZambiaZimbabwe Timeline:
This timeline shows a graph from 1971 to 2016 of Middle East & North Africa. No data until 1970. Number of actual observations by date: 46.
Source name:
World Development Indicators
Source organization:
International Civil Aviation Organization, Civil Aviation Statistics of the World and ICAO staff estimates.
Categories, topics:
Infrastructure
Last updated:
apr 23, 2017
Indicators value changes by year
Minimum:
5.303 mln
jan 1, 1971
Maximum:
217.208 mln
jan 1, 2016
At the date of observation
Value
Absolute change
Change from previous value
jan 1, 1971
5.303 mln
+5.303 mln
0.0%
jan 1, 1972
6.429 mln
+1.126 mln
21.24%
jan 1, 1973
7.529 mln
+1.1 mln
17.11%
jan 1, 1974
8.688 mln
+1.159 mln
15.39%
jan 1, 1975
10.598 mln
+1.91 mln
21.98%
jan 1, 1976
13.017 mln
+2.419 mln
22.83%
jan 1, 1977
16.872 mln
+3.856 mln
29.62%
jan 1, 1978
20.259 mln
+3.387 mln
20.07%
jan 1, 1979
23.545 mln
+3.286 mln
16.22%
jan 1, 1980
25.388 mln
+1.843 mln
7.83%
jan 1, 1981
27.859 mln
+2.471 mln
9.73%
jan 1, 1982
28.681 mln
+822.1K
2.95%
jan 1, 1983
30.857 mln
+2.176 mln
7.59%
jan 1, 1984
33.496 mln
+2.639 mln
8.55%
jan 1, 1985
35.297 mln
+1.801 mln
5.38%
jan 1, 1986
34.822 mln
-474.4K
-1.34%
jan 1, 1987
34.087 mln
-735.3K
-2.11%
jan 1, 1988
35.611 mln
+1.524 mln
4.47%
jan 1, 1989
36.642 mln
+1.03 mln
2.89%
jan 1, 1990
38.333 mln
+1.692 mln
4.62%
jan 1, 1991
38.928 mln
+594.6K
1.55%
jan 1, 1992
36.421 mln
-2.507 mln
-6.44%
jan 1, 1993
41.138 mln
+4.717 mln
12.95%
jan 1, 1994
42.087 mln
+949.4K
2.31%
jan 1, 1995
45.081 mln
+2.994 mln
7.11%
jan 1, 1996
45.976 mln
+895.3K
1.99%
jan 1, 1997
49.613 mln
+3.637 mln
7.91%
jan 1, 1998
53.726 mln
+4.113 mln
8.29%
jan 1, 1999
53.714 mln
-12.1K
-0.02%
jan 1, 2000
56.424 mln
+2.71 mln
5.05%
jan 1, 2001
59.655 mln
+3.231 mln
5.73%
jan 1, 2002
67.991 mln
+8.337 mln
13.97%
jan 1, 2003
64.356 mln
-3.635 mln
-5.35%
jan 1, 2004
73.217 mln
+8.861 mln
13.77%
jan 1, 2005
78.561 mln
+5.344 mln
7.3%
jan 1, 2006
61.432 mln
-17.129 mln
-21.8%
jan 1, 2007
66.639 mln
+5.207 mln
8.48%
jan 1, 2008
71.223 mln
+4.584 mln
6.88%
jan 1, 2009
71.071 mln
-152.09K
-0.21%
jan 1, 2010
114.274 mln
+43.203 mln
60.79%
jan 1, 2011
151.073 mln
+36.799 mln
32.2%
jan 1, 2012
160.272 mln
+9.199 mln
6.09%
jan 1, 2013
175.337 mln
+15.066 mln
9.4%
jan 1, 2014
188.898 mln
+13.56 mln
7.73%
jan 1, 2015
204.154 mln
+15.256 mln
8.08%
jan 1, 2016
217.208 mln
+13.054 mln
6.39%
Ranking of countries by current statistics by years


Comments: