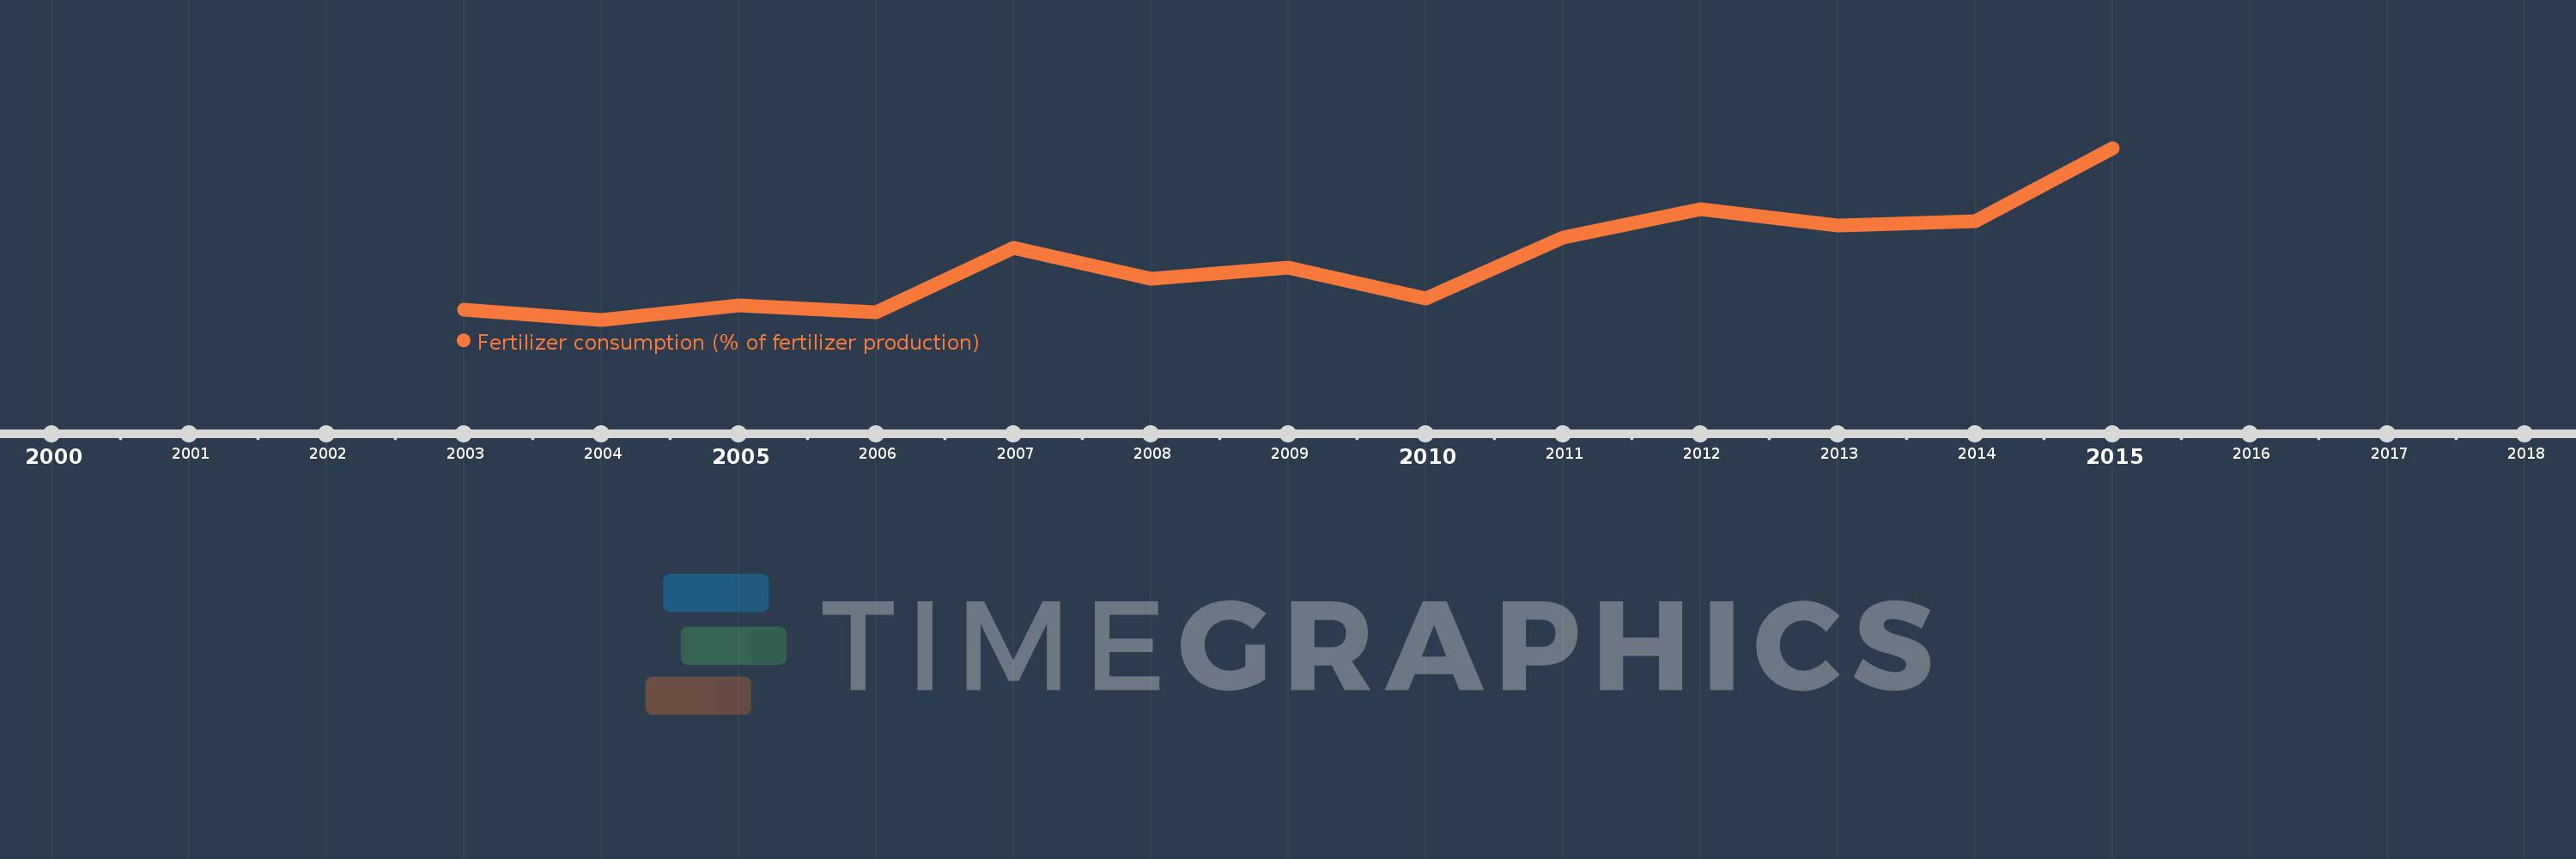
This timeline shows a graph from 2003 to 2015 of Sub-Saharan Africa (IDA & IBRD countries). No data until 2002. Number of actual observations by date: 13.
Source name:
World Development Indicators
Source organization:
Food and Agriculture Organization, electronic files and web site.
Categories, topics:
Agriculture & Rural Development
Last updated:
apr 23, 2017
Indicators value changes by year
Meaning:
295.477
Minimum:
152.643
jan 1, 2004
Maximum:
564.608
jan 1, 2015
At the date of observation
Value
Absolute change
Change from the previous value
jan 1, 2003
176.254
+176.254
0.0%
jan 1, 2004
152.643
-23.611
-13.4%
jan 1, 2005
187.397
+34.754
22.77%
jan 1, 2006
170.777
-16.619
-8.87%
jan 1, 2007
325.517
+154.74
90.61%
jan 1, 2008
250.203
-75.314
-23.14%
jan 1, 2009
277.339
+27.136
10.85%
jan 1, 2010
202.915
-74.424
-26.84%
jan 1, 2011
349.744
+146.829
72.36%
jan 1, 2012
417.46
+67.716
19.36%
jan 1, 2013
377.777
-39.683
-9.51%
jan 1, 2014
388.565
+10.788
2.86%
jan 1, 2015
564.608
+176.043
45.31%
Ranking of countries by current statistics by years
