This statistics in other country:
Timeline:
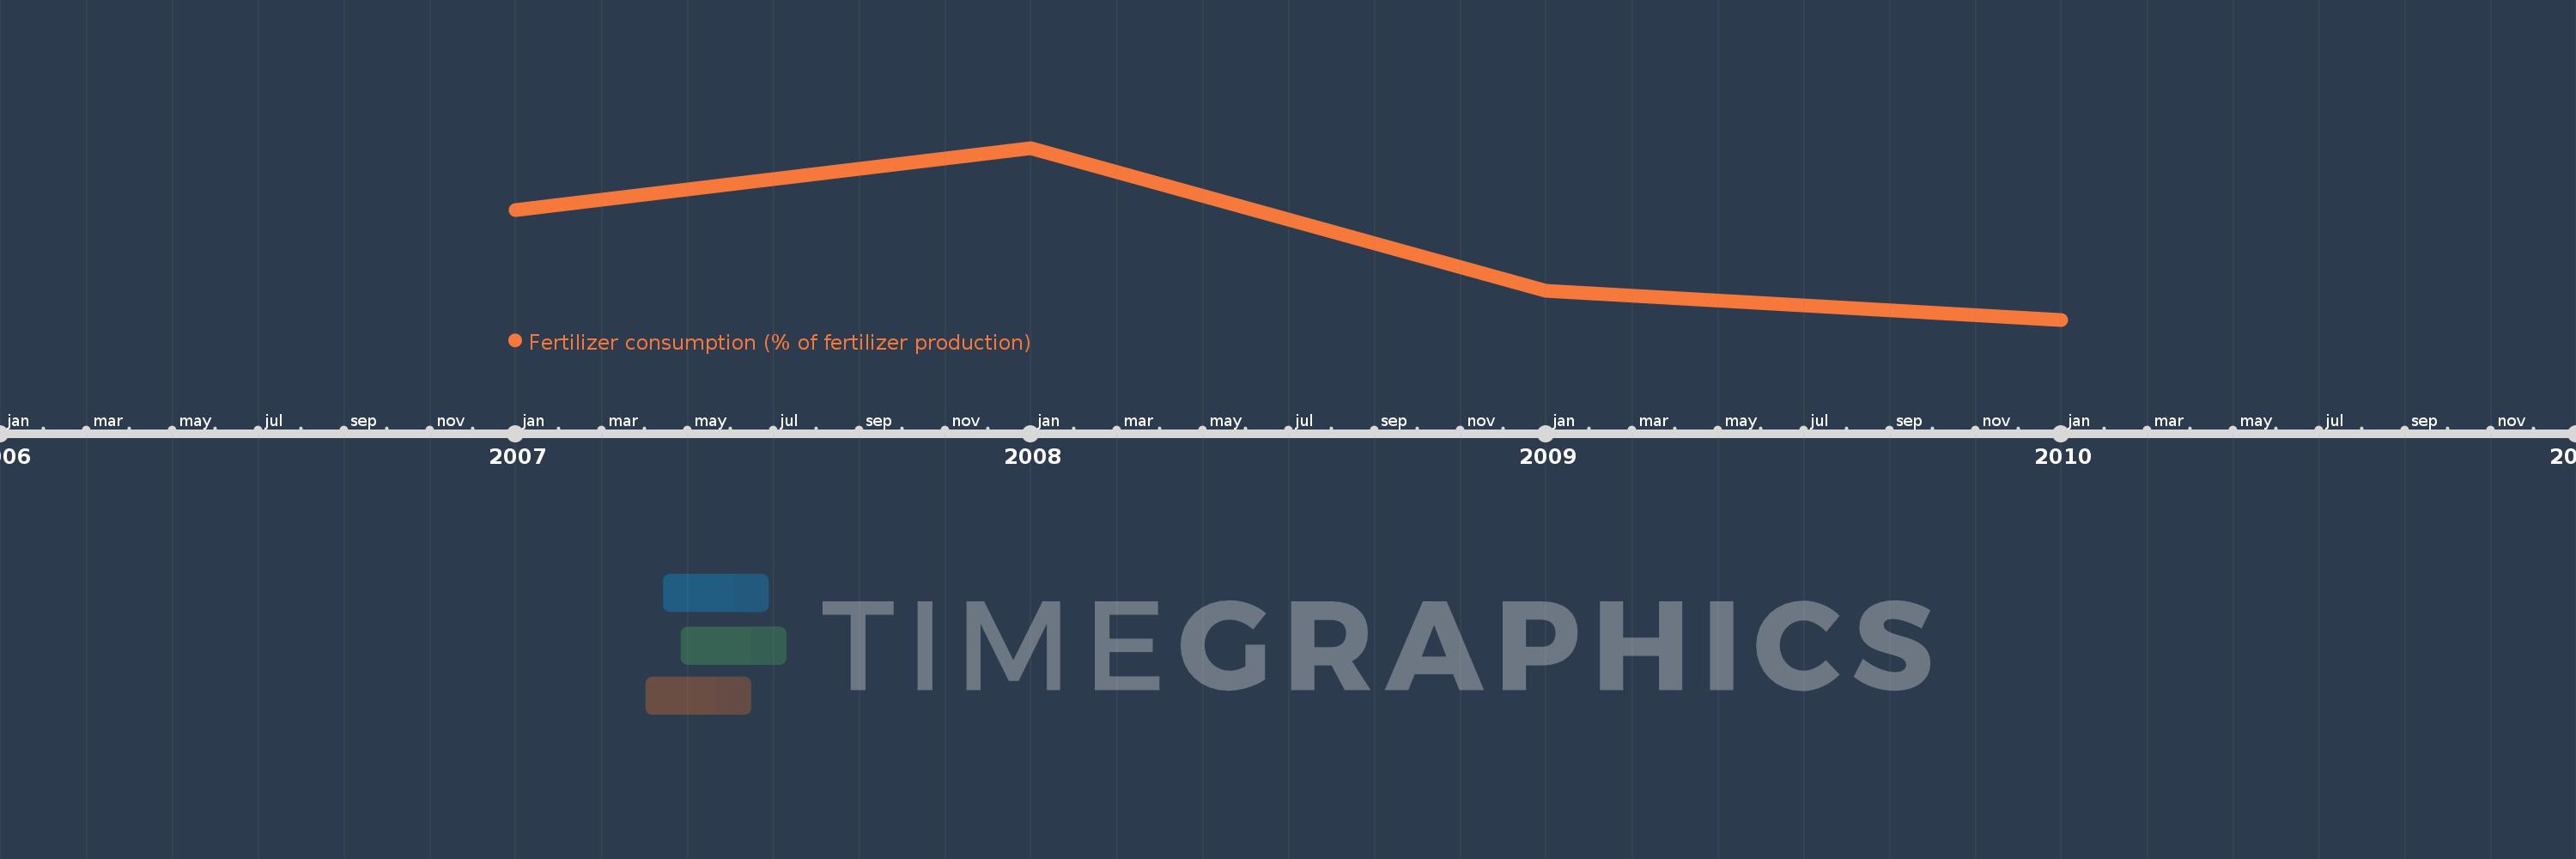
This timeline shows a graph from 2007 to 2010 of Malawi. No data until 2006. Number of actual observations by date: 4.
Source name:
World Development Indicators
Source organization:
Food and Agriculture Organization, electronic files and web site.
Categories, topics:
Agriculture & Rural Development
Last updated:
apr 23, 2017
Indicators value changes by year
Minimum:
59.978K
jan 1, 2010
Maximum:
96.274K
jan 1, 2008
At the date of observation
Value
Absolute change
Change from previous value
jan 1, 2007
83.234K
+83.234K
0.0%
jan 1, 2008
96.274K
+13.04K
15.67%
jan 1, 2009
66.101K
-30.173K
-31.34%
jan 1, 2010
59.978K
-6.123K
-9.26%
Ranking of countries by current statistics by years


Comments: