29
/
en
AIzaSyAYiBZKx7MnpbEhh9jyipgxe19OcubqV5w
April 1, 2024
101046
Canada
CAN
true
2
1
Fertilizer consumption (% of fertilizer production)
2015,2014,2013,2012,2011,2010,2009,2008,2007,2006,2005,2004,2003
Download
Global statistics library →Canada →

Fertilizer consumption (% of fertilizer production)

This statistics in other country:
AfghanistanAlgeriaArab WorldArgentinaArmeniaAustraliaBahrainBangladeshBelarusBelgiumBosnia and HerzegovinaBrazilBulgariaCanadaCaribbean small statesCentral Europe and the BalticsChileChinaColombiaCroatiaCubaCzech RepublicDenmarkEarly-demographic dividendEast Asia & PacificEast Asia & Pacific (excluding high income)East Asia & Pacific (IDA & IBRD countries)Egypt, Arab Rep.EstoniaEuro areaEurope & Central AsiaEurope & Central Asia (excluding high income)Europe & Central Asia (IDA & IBRD countries)European UnionFinlandFragile and conflict affected situationsFranceGeorgiaGermanyGreeceHeavily indebted poor countries (HIPC)High incomeHungaryIBRD onlyIDA & IBRD totalIDA blendIDA onlyIDA totalIndiaIndonesiaIran, Islamic Rep.IraqIrelandIsraelItalyJapanJordanKazakhstanKorea, Rep.KuwaitLate-demographic dividendLatin America & Caribbean Latin America & Caribbean (excluding high income)Latin America & the Caribbean (IDA & IBRD countries)Least developed countries: UN classificationLebanonLibyaLithuaniaLow & middle incomeLow incomeLower middle incomeMalawiMalaysiaMaliMauritiusMexicoMiddle East & North AfricaMiddle East & North Africa (excluding high income)Middle East & North Africa (IDA & IBRD countries)Middle incomeMoroccoMyanmarNetherlandsNew ZealandNigeriaNorth AmericaNorwayOECD membersOmanOther small statesPakistanPeruPhilippinesPolandPortugalPost-demographic dividendPre-demographic dividendQatarRomaniaRussian FederationSaudi ArabiaSenegalSerbiaSlovak RepublicSloveniaSmall statesSouth AfricaSouth AsiaSouth Asia (IDA & IBRD)SpainSri LankaSub-Saharan Africa Sub-Saharan Africa (excluding high income)Sub-Saharan Africa (IDA & IBRD countries)SwedenSyrian Arab RepublicTajikistanThailandTrinidad and TobagoTunisiaTurkeyUkraineUnited Arab EmiratesUnited KingdomUnited StatesUpper middle incomeUruguayUzbekistanVenezuela, RBVietnamWorldZimbabwe
Timeline:
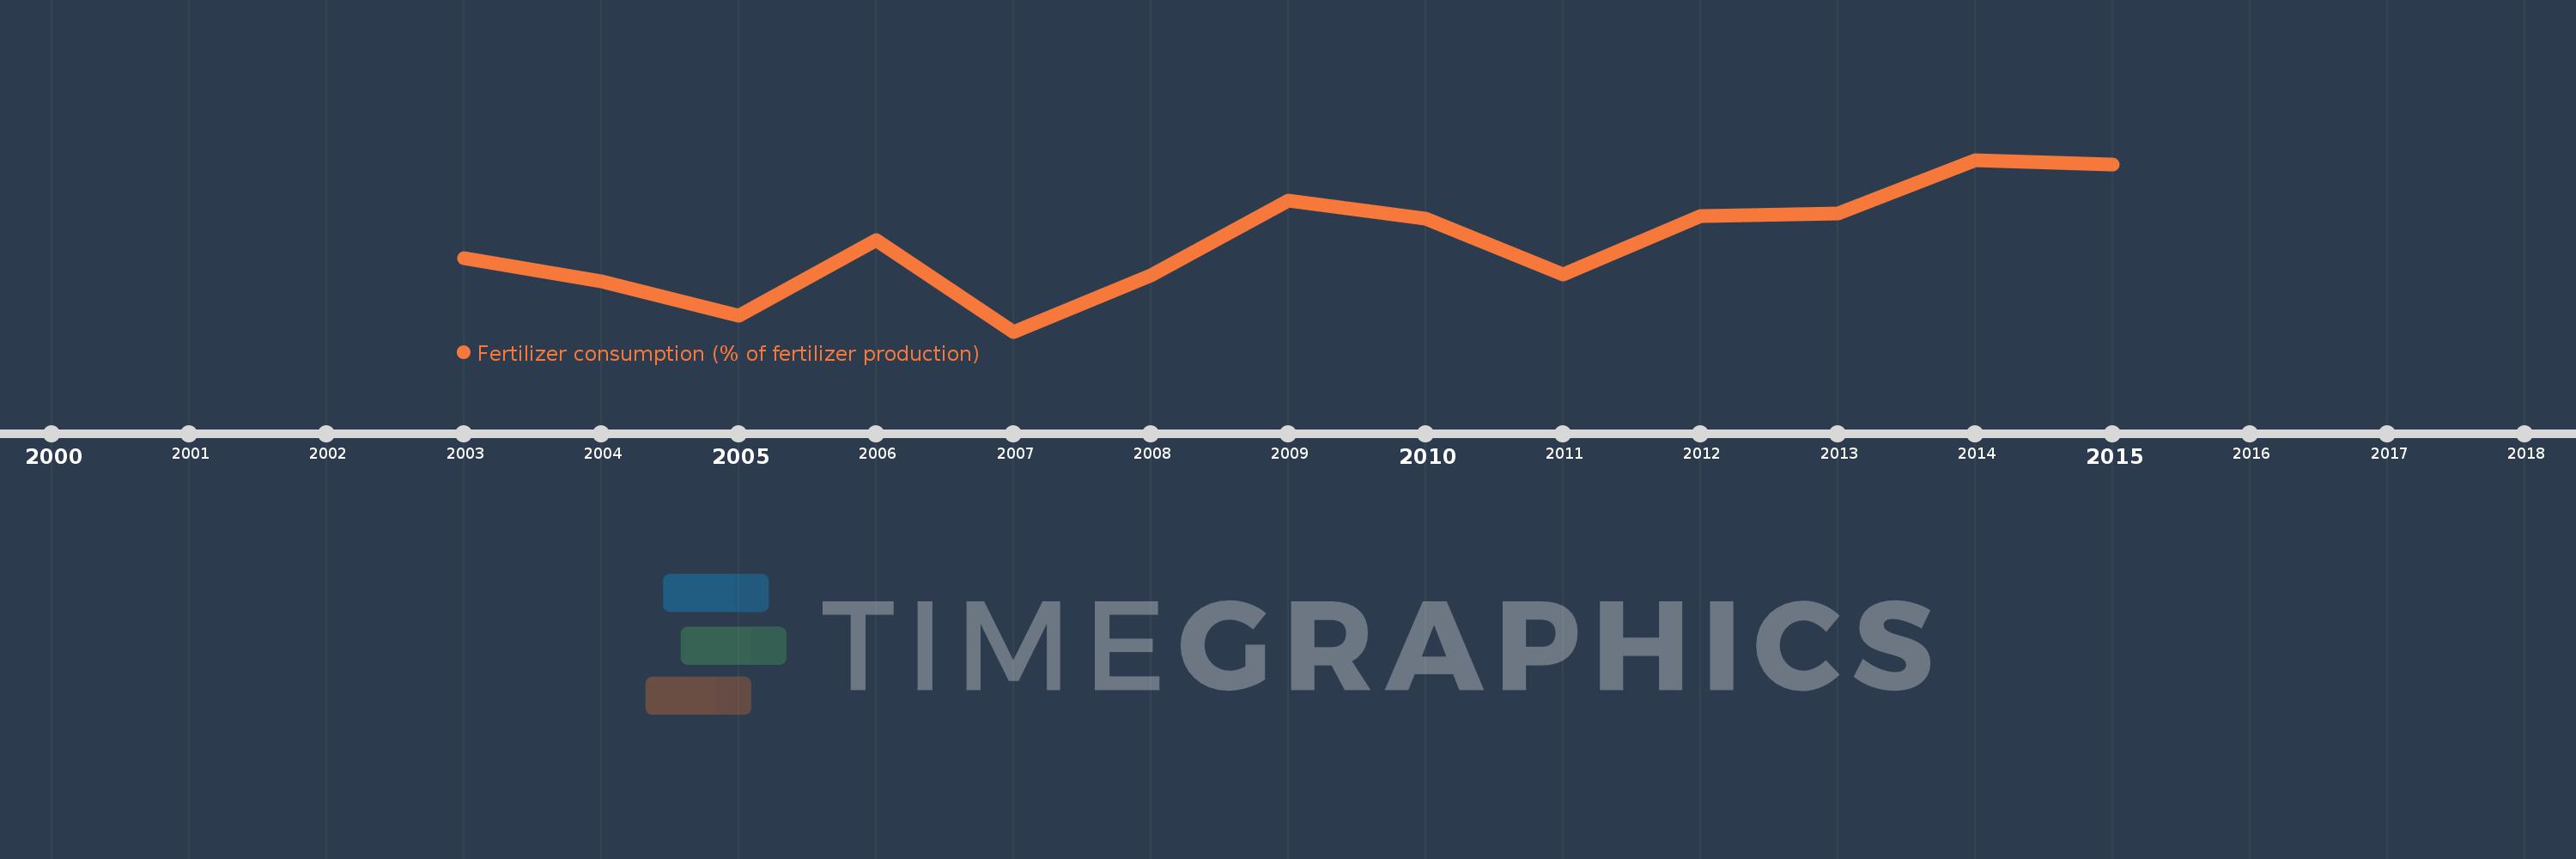
This timeline shows a graph from 2003 to 2015 of Canada. No data until 2002. Number of actual observations by date: 13.
Source name:
World Development Indicators
Source organization:
Food and Agriculture Organization, electronic files and web site.
Categories, topics:
Agriculture & Rural Development
Last updated:
apr 23, 2017
Indicators value changes by year
Mean:
24.211
Minimum:
16.821
jan 1, 2007
Maximum:
31.06
jan 1, 2014
At the date of observation
Value
Absolute change
Change from previous value
jan 1, 2003
22.887
+22.887
0.0%
jan 1, 2004
21.003
-1.884
-8.23%
jan 1, 2005
18.116
-2.887
-13.75%
jan 1, 2006
24.419
+6.302
34.79%
jan 1, 2007
16.821
-7.598
-31.12%
jan 1, 2008
21.449
+4.628
27.51%
jan 1, 2009
27.649
+6.2
28.91%
jan 1, 2010
26.173
-1.475
-5.34%
jan 1, 2011
21.548
-4.625
-17.67%
jan 1, 2012
26.378
+4.83
22.42%
jan 1, 2013
26.592
+0.214
0.81%
jan 1, 2014
31.06
+4.468
16.8%
jan 1, 2015
30.648
-0.412
-1.33%
Ranking of countries by current statistics by years

Comments:

Send
PremiumAbout & FeedbackTermsPrivacy
logo
© 2022 Selected Technologies LLC – Morgan Hill, California