29
/
en
AIzaSyAYiBZKx7MnpbEhh9jyipgxe19OcubqV5w
April 1, 2024
24067
Arab World
ARB
false
2
1
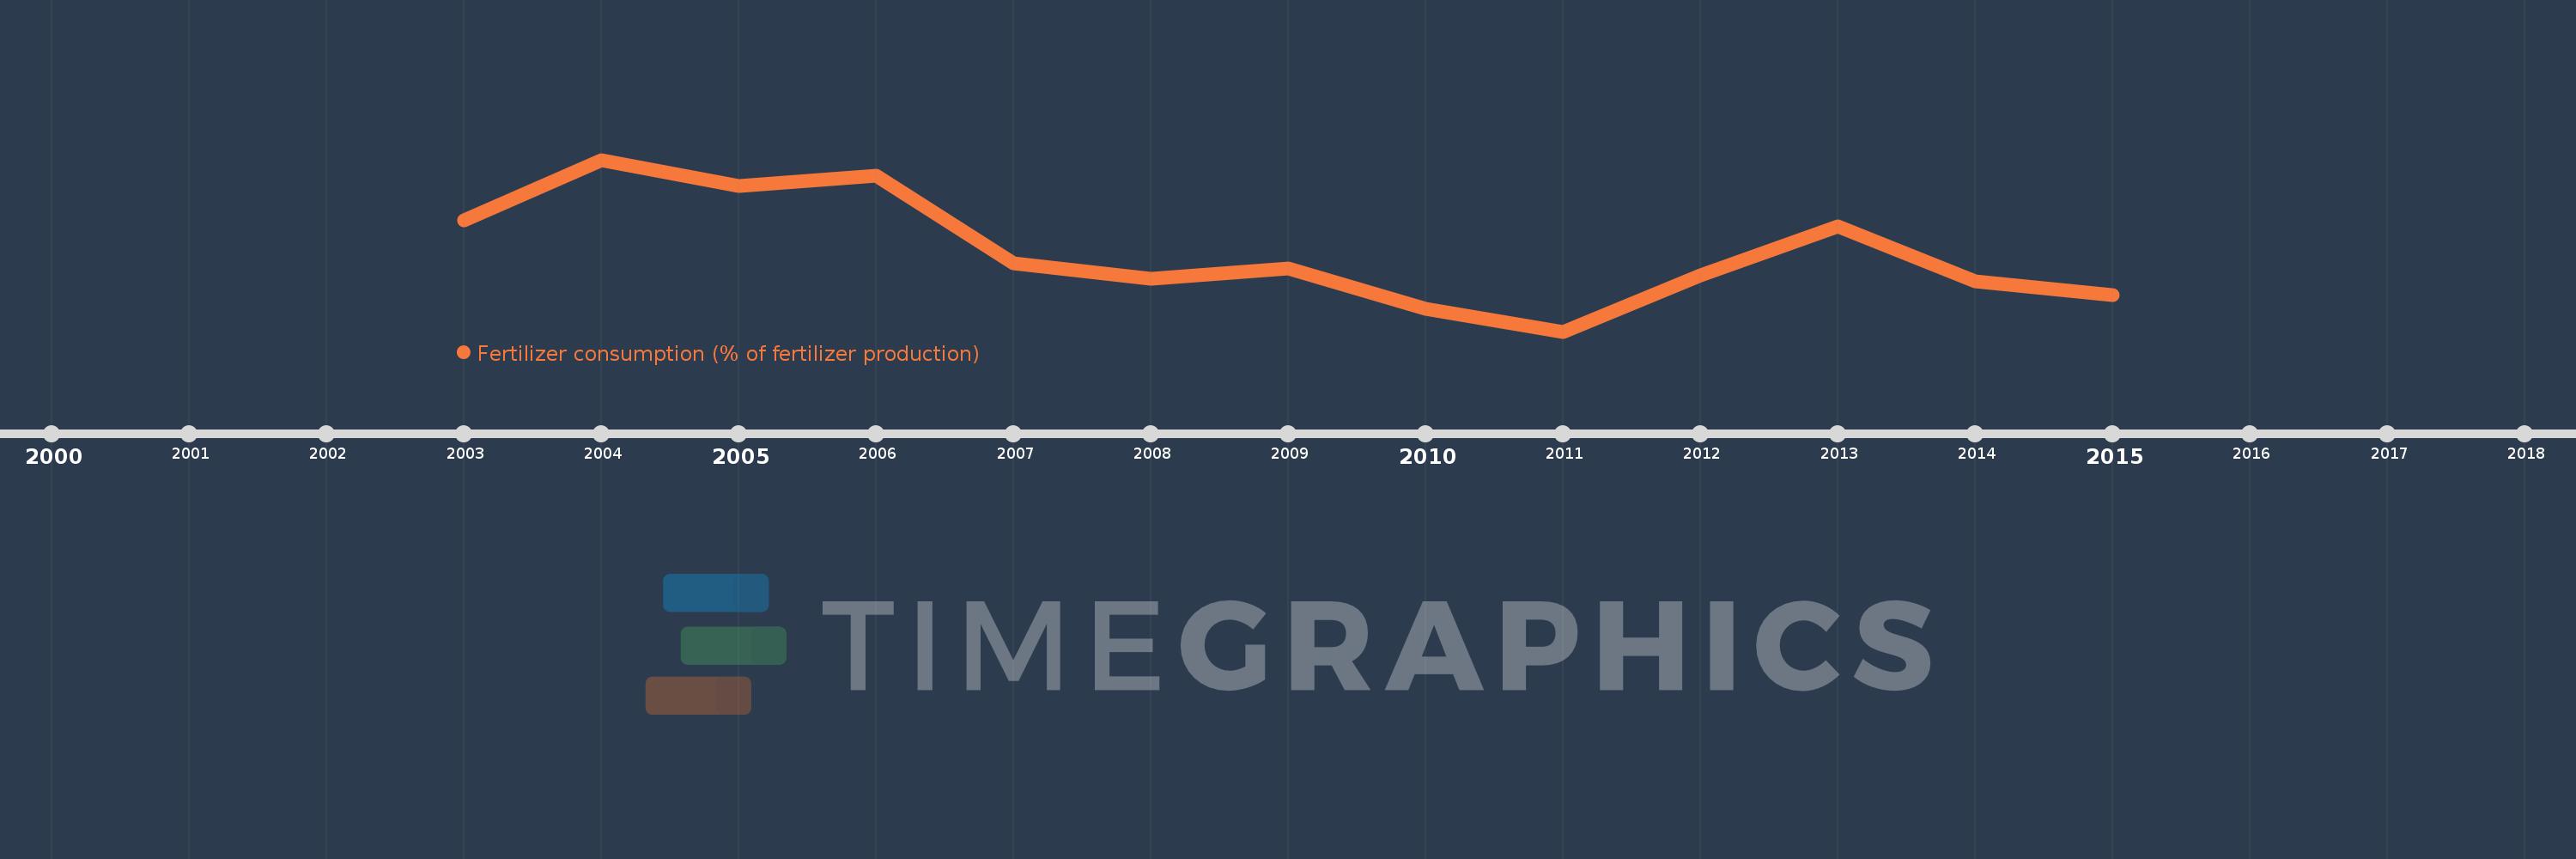
Fertilizer consumption (% of fertilizer production)
2015,2014,2013,2012,2011,2010,2009,2008,2007,2006,2005,2004,2003
This statistics in other country:
Timeline:
This timeline shows a graph from 2003 to 2015 of Arab World. No data until 2002. Number of actual observations by date: 13.
Source name:
World Development Indicators
Source organization:
Food and Agriculture Organization, electronic files and web site.
Categories, topics:
Agriculture & Rural Development
Last updated:
apr 23, 2017
Indicators value changes by year
Minimum:
22.707
jan 1, 2011
Maximum:
36.234
jan 1, 2004
At the date of observation
Value
Absolute change
Change from previous value
jan 1, 2003
31.461
+31.461
0.0%
jan 1, 2004
36.234
+4.773
15.17%
jan 1, 2005
34.142
-2.092
-5.77%
jan 1, 2006
35.004
+0.863
2.53%
jan 1, 2007
28.08
-6.924
-19.78%
jan 1, 2008
26.846
-1.234
-4.39%
jan 1, 2009
27.7
+0.854
3.18%
jan 1, 2010
24.496
-3.204
-11.57%
jan 1, 2011
22.707
-1.789
-7.3%
jan 1, 2012
27.115
+4.408
19.41%
jan 1, 2013
31.011
+3.896
14.37%
jan 1, 2014
26.667
-4.344
-14.01%
jan 1, 2015
25.554
-1.113
-4.17%
Ranking of countries by current statistics by years


Comments: