29
/
en
AIzaSyAYiBZKx7MnpbEhh9jyipgxe19OcubqV5w
April 1, 2024
54742
Post-demographic dividend
PST
false
2
1
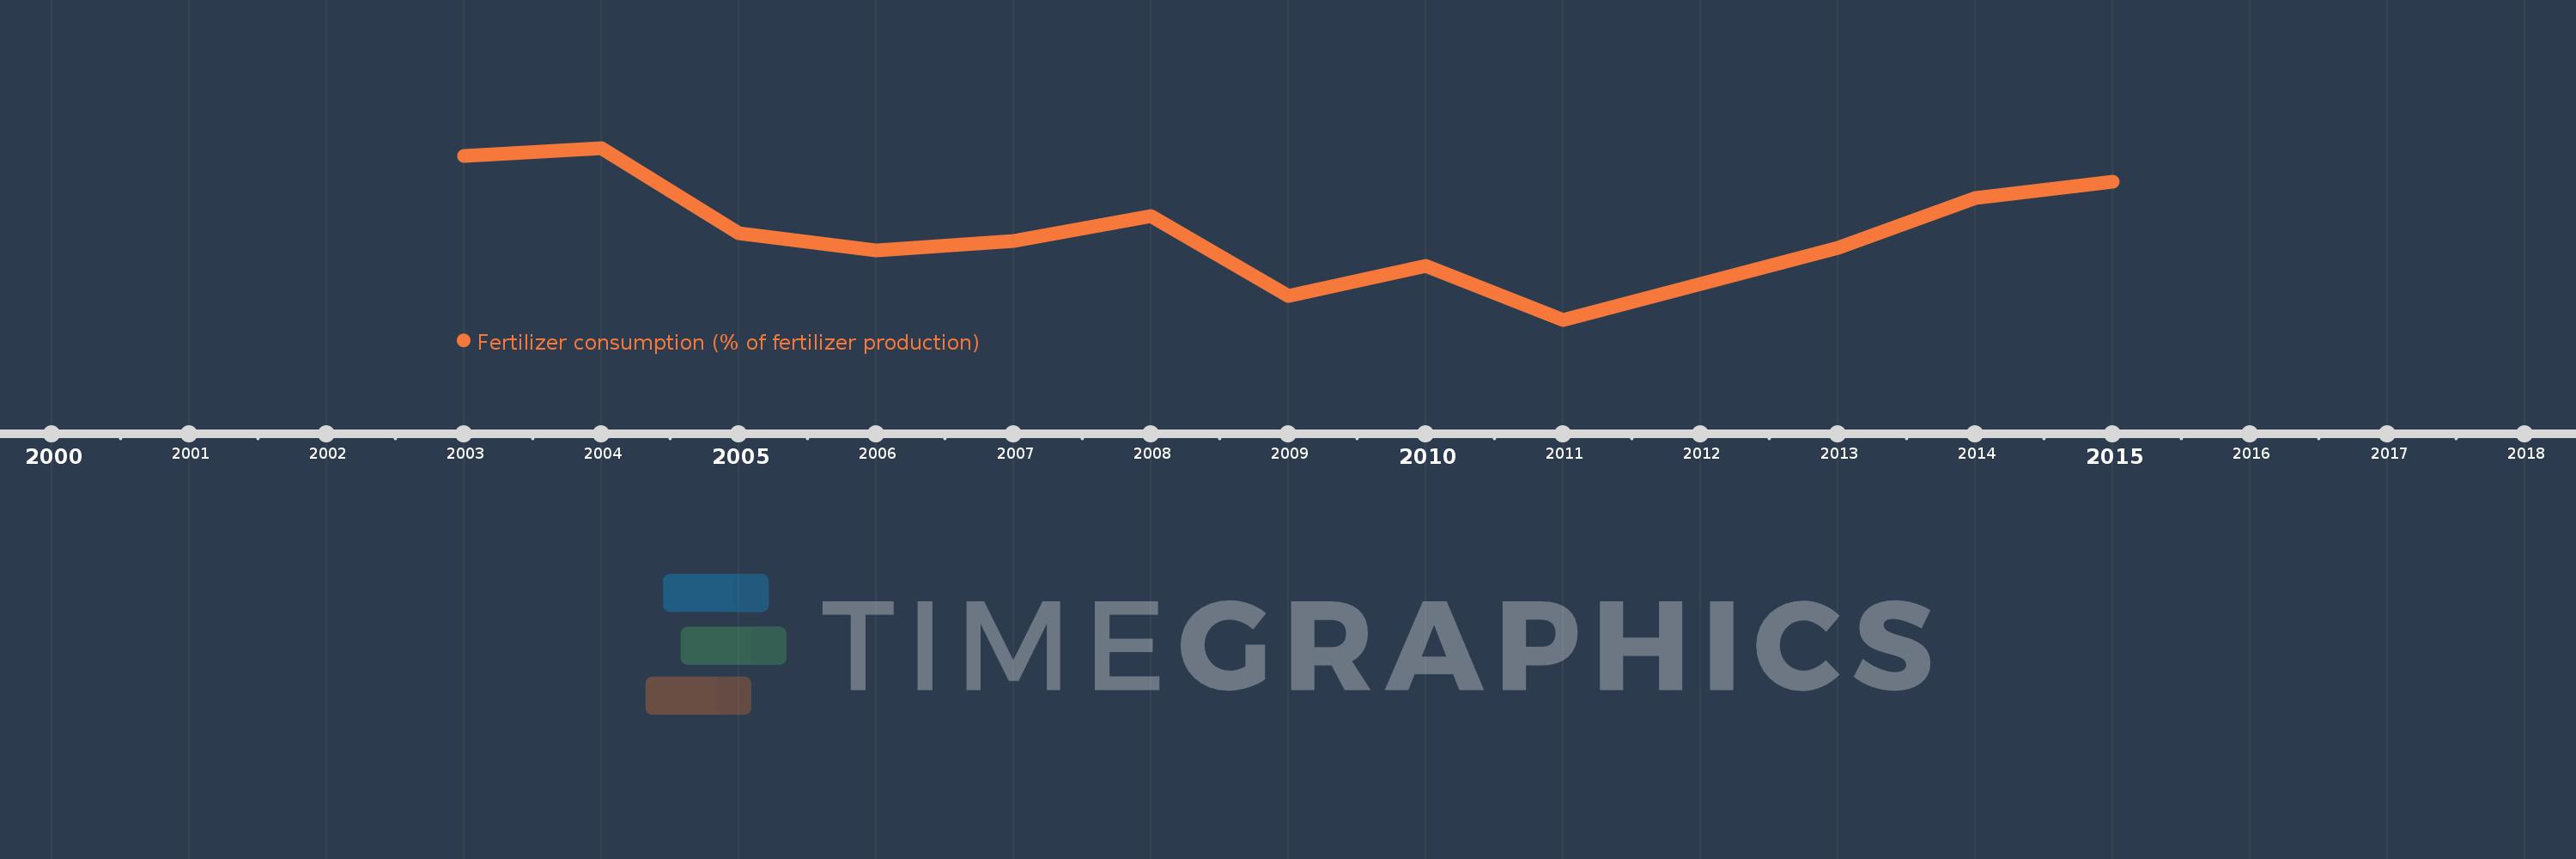
Fertilizer consumption (% of fertilizer production)
2015,2014,2013,2012,2011,2010,2009,2008,2007,2006,2005,2004,2003
This statistics in other country:
Timeline:
This timeline shows a graph from 2003 to 2015 of Post-demographic dividend. No data until 2002. Number of actual observations by date: 13.
Source name:
World Development Indicators
Source organization:
Food and Agriculture Organization, electronic files and web site.
Categories, topics:
Agriculture & Rural Development
Last updated:
apr 23, 2017
Indicators value changes by year
Minimum:
65.911
jan 1, 2011
Maximum:
77.902
jan 1, 2004
At the date of observation
Value
Absolute change
Change from previous value
jan 1, 2003
77.36
+77.36
0.0%
jan 1, 2004
77.902
+0.542
0.7%
jan 1, 2005
71.928
-5.974
-7.67%
jan 1, 2006
70.721
-1.207
-1.68%
jan 1, 2007
71.435
+0.714
1.01%
jan 1, 2008
73.124
+1.689
2.36%
jan 1, 2009
67.589
-5.535
-7.57%
jan 1, 2010
69.664
+2.075
3.07%
jan 1, 2011
65.911
-3.753
-5.39%
jan 1, 2012
68.4
+2.489
3.78%
jan 1, 2013
70.959
+2.56
3.74%
jan 1, 2014
74.408
+3.449
4.86%
jan 1, 2015
75.539
+1.13
1.52%
Ranking of countries by current statistics by years


Comments: