29
/
en
AIzaSyAYiBZKx7MnpbEhh9jyipgxe19OcubqV5w
April 1, 2024
115759
Cuba
CUB
true
2
1
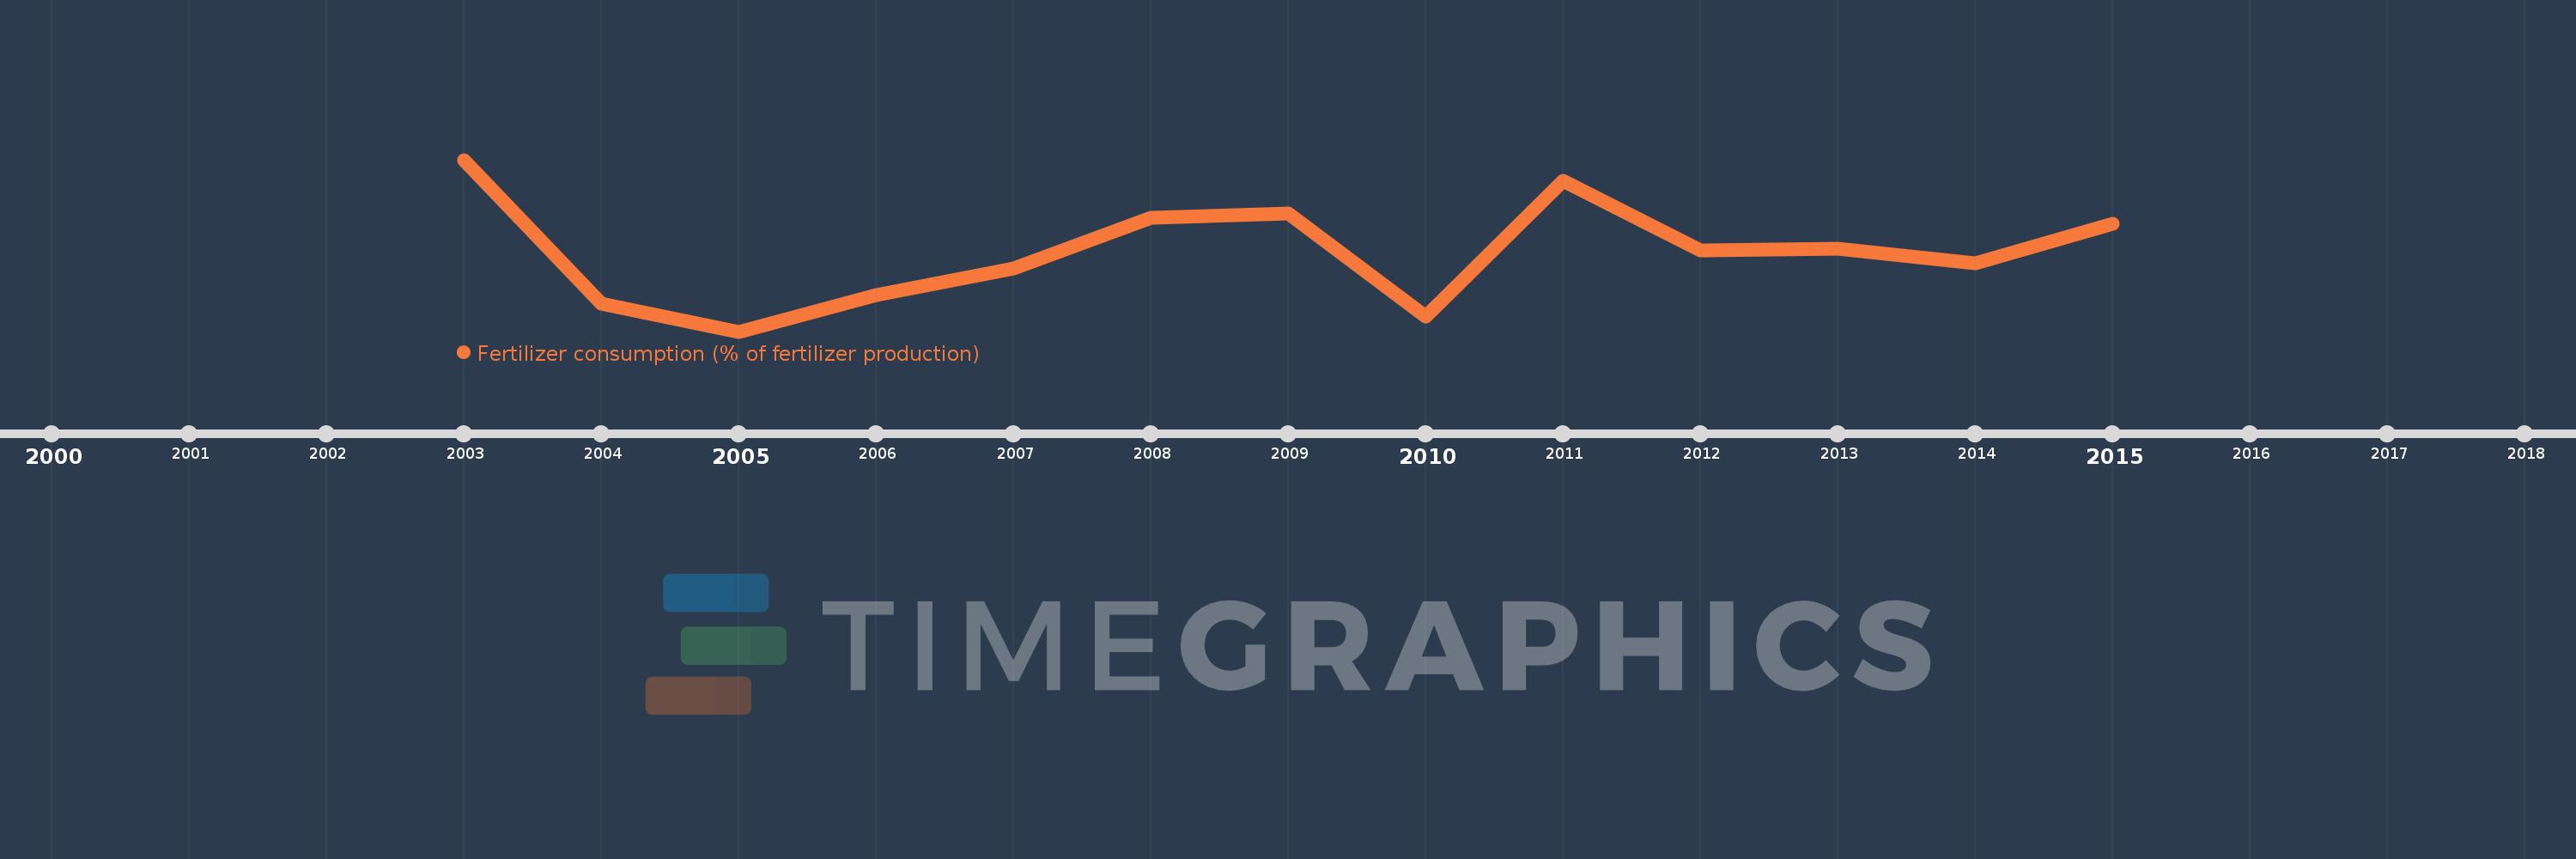
Fertilizer consumption (% of fertilizer production)
2015,2014,2013,2012,2011,2010,2009,2008,2007,2006,2005,2004,2003
This statistics in other country:
Timeline:
This timeline shows a graph from 2003 to 2015 of Cuba. No data until 2002. Number of actual observations by date: 13.
Source name:
World Development Indicators
Source organization:
Food and Agriculture Organization, electronic files and web site.
Categories, topics:
Agriculture & Rural Development
Last updated:
apr 23, 2017
Indicators value changes by year
Minimum:
250.778
jan 1, 2005
Maximum:
754.901
jan 1, 2003
At the date of observation
Value
Absolute change
Change from previous value
jan 1, 2003
754.901
+754.901
0.0%
jan 1, 2004
333.125
-421.775
-55.87%
jan 1, 2005
250.778
-82.347
-24.72%
jan 1, 2006
358.771
+107.993
43.06%
jan 1, 2007
436.981
+78.21
21.8%
jan 1, 2008
584.114
+147.133
33.67%
jan 1, 2009
598.169
+14.055
2.41%
jan 1, 2010
294.128
-304.041
-50.83%
jan 1, 2011
692.396
+398.267
135.41%
jan 1, 2012
489.554
-202.842
-29.3%
jan 1, 2013
493.035
+3.481
0.71%
jan 1, 2014
450.088
-42.947
-8.71%
jan 1, 2015
566.548
+116.46
25.87%
Ranking of countries by current statistics by years


Comments: