29
/
en
AIzaSyAYiBZKx7MnpbEhh9jyipgxe19OcubqV5w
April 1, 2024
60502
Sub-Saharan Africa (excluding high income)
SSA
false
2
1
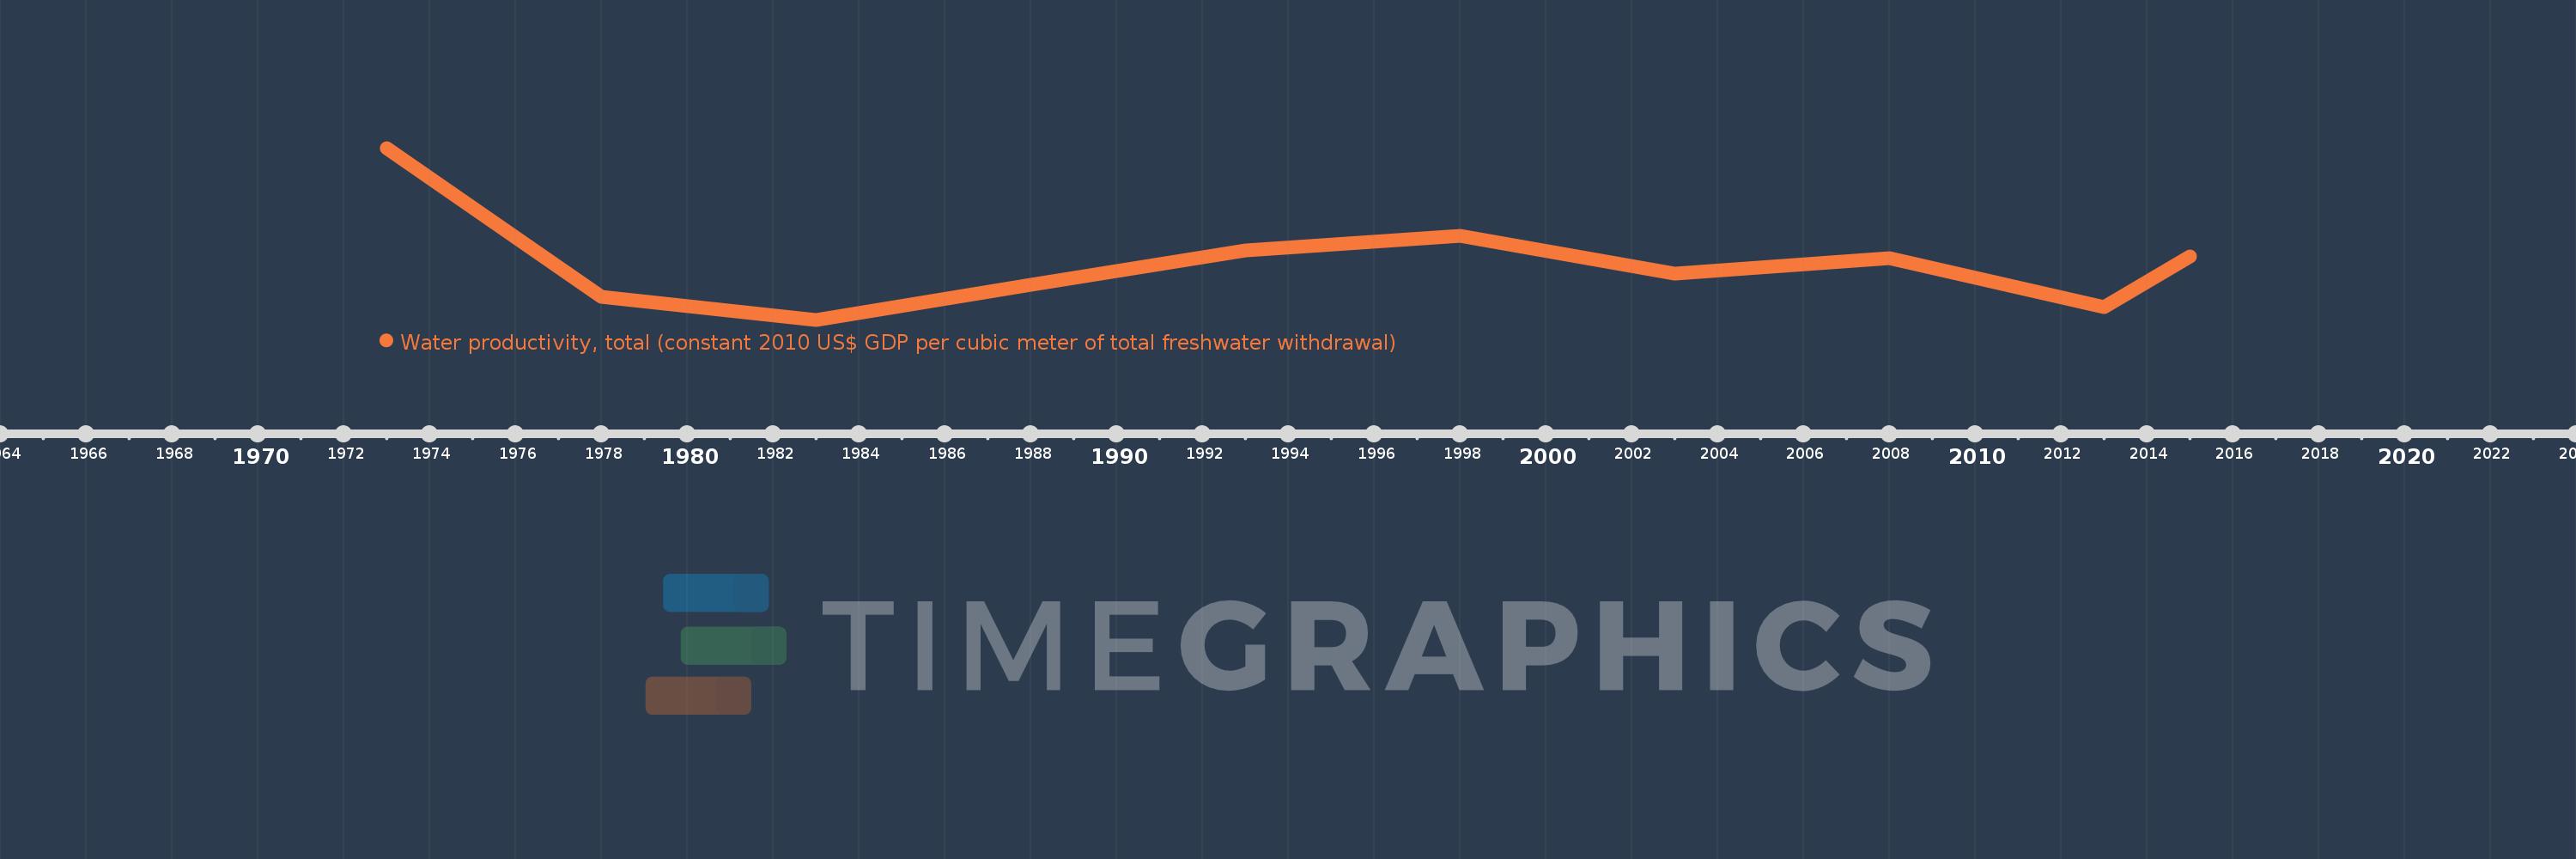
Water productivity, total (constant 2010 US$ GDP per cubic meter of total freshwater withdrawal)
2015,2013,2008,2003,1998,1993,1988,1983,1978,1973
This statistics in other country:
Timeline:
This timeline shows a graph from 1973 to 2015 of Sub-Saharan Africa (excluding high income). No data until 1972. Number of actual observations by date: 10.
Source name:
World Development Indicators
Source organization:
Food and Agriculture Organization, AQUASTAT data, and World Bank and OECD GDP estimates.
Categories, topics:
Environment
Last updated:
apr 23, 2017
Indicators value changes by year
Maximum:
32.157
jan 1, 1973
At the date of observation
Value
Absolute change
Change from previous value
jan 1, 1973
32.157
+32.157
0.0%
jan 1, 1978
6.287
-25.869
-80.45%
jan 1, 1983
2.309
-3.978
-63.28%
jan 1, 1988
8.457
+6.148
266.27%
jan 1, 1993
14.405
+5.949
70.34%
jan 1, 1998
16.907
+2.502
17.37%
jan 1, 2003
10.254
-6.654
-39.35%
jan 1, 2008
12.984
+2.73
26.63%
jan 1, 2013
4.455
-8.529
-65.69%
jan 1, 2015
13.342
+8.887
199.5%
Ranking of countries by current statistics by years


Comments: