29
/
en
AIzaSyAYiBZKx7MnpbEhh9jyipgxe19OcubqV5w
April 1, 2024
33991
European Union
EUU
false
2
1
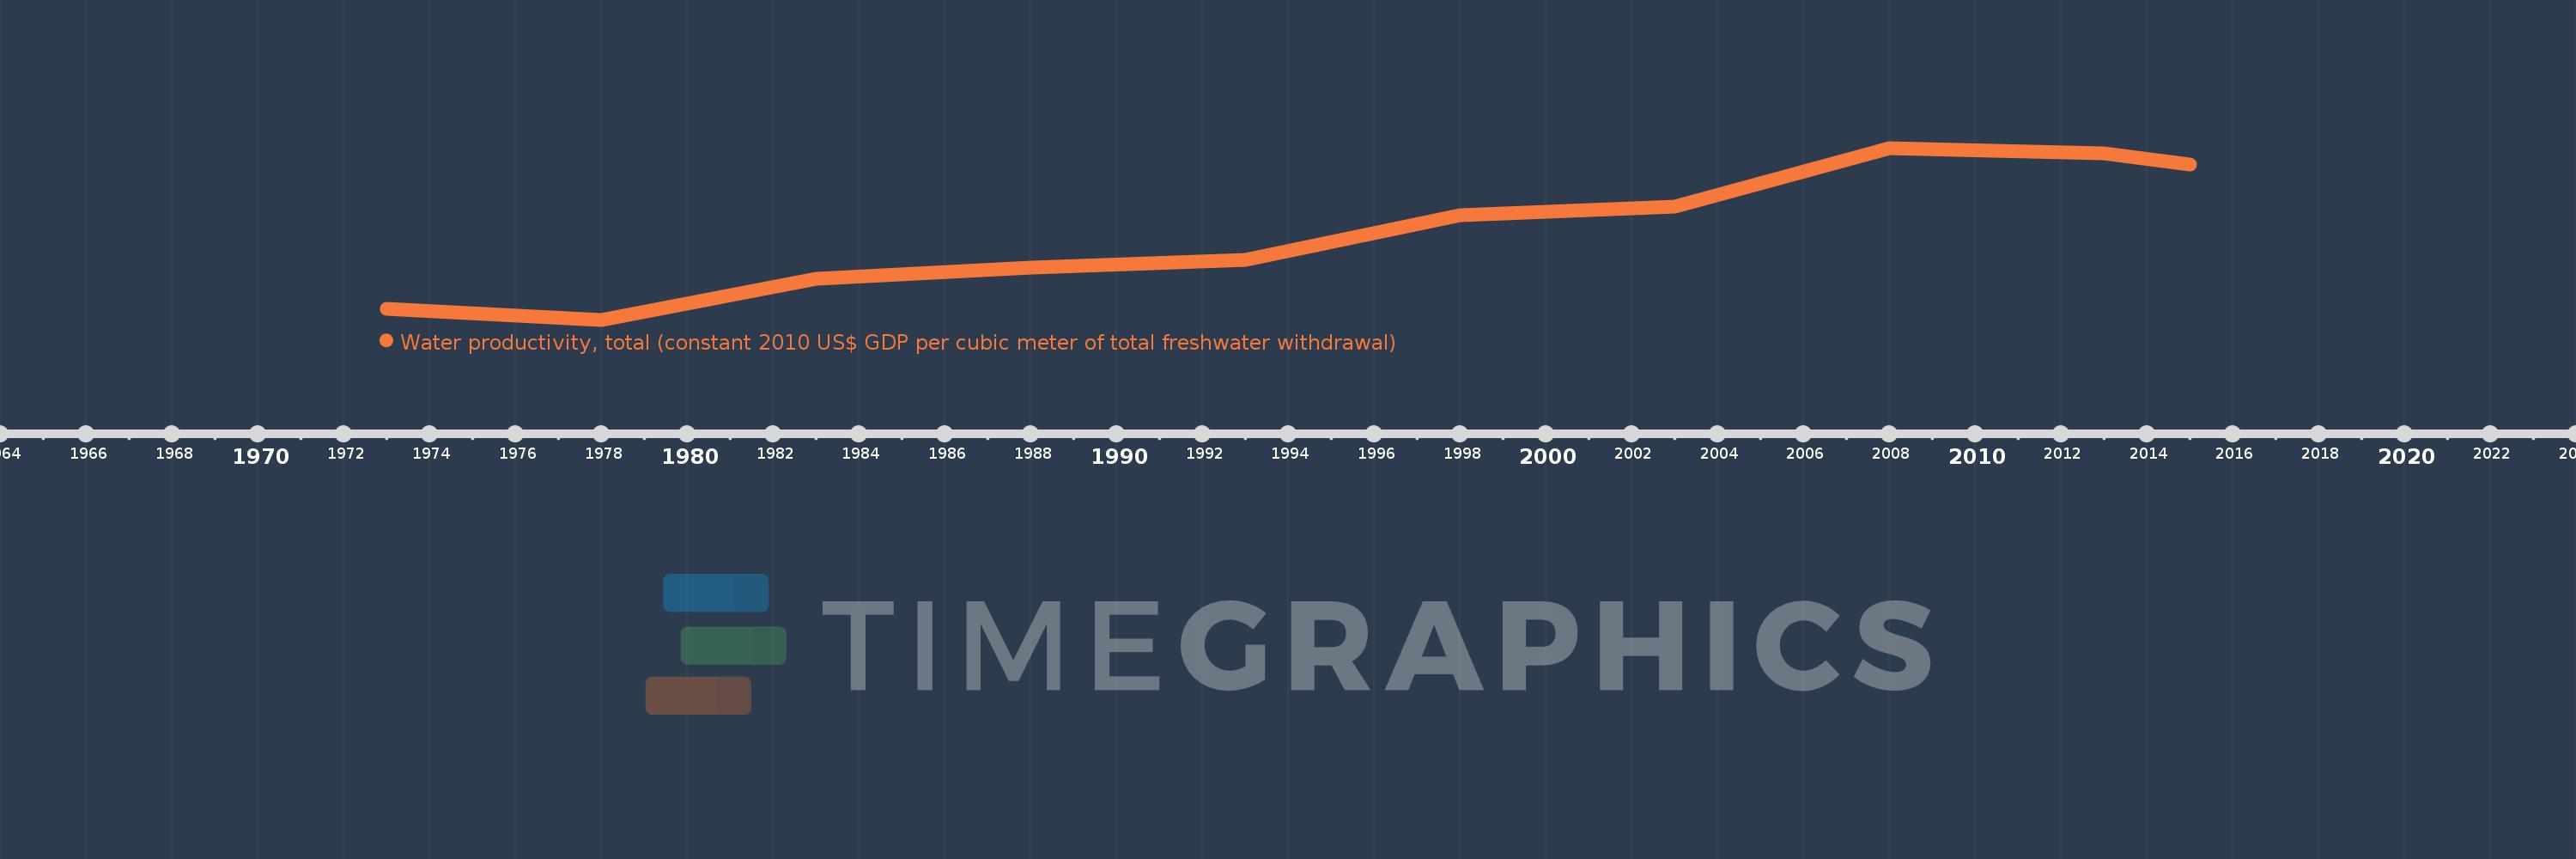
Water productivity, total (constant 2010 US$ GDP per cubic meter of total freshwater withdrawal)
2015,2013,2008,2003,1998,1993,1988,1983,1978,1973
This statistics in other country:
Timeline:
This timeline shows a graph from 1973 to 2015 of European Union. No data until 1972. Number of actual observations by date: 10.
Source name:
World Development Indicators
Source organization:
Food and Agriculture Organization, AQUASTAT data, and World Bank and OECD GDP estimates.
Categories, topics:
Environment
Last updated:
apr 23, 2017
Indicators value changes by year
Minimum:
27.048
jan 1, 1978
Maximum:
75.387
jan 1, 2008
At the date of observation
Value
Absolute change
Change from previous value
jan 1, 1973
30.178
+30.178
0.0%
jan 1, 1978
27.048
-3.13
-10.37%
jan 1, 1983
38.591
+11.544
42.68%
jan 1, 1988
41.788
+3.196
8.28%
jan 1, 1993
44.006
+2.218
5.31%
jan 1, 1998
56.487
+12.482
28.36%
jan 1, 2003
58.851
+2.363
4.18%
jan 1, 2008
75.387
+16.537
28.1%
jan 1, 2013
73.911
-1.476
-1.96%
jan 1, 2015
70.637
-3.275
-4.43%
Ranking of countries by current statistics by years


Comments: