29
/
en
AIzaSyAYiBZKx7MnpbEhh9jyipgxe19OcubqV5w
April 1, 2024
37099
IBRD only
IBD
false
2
1
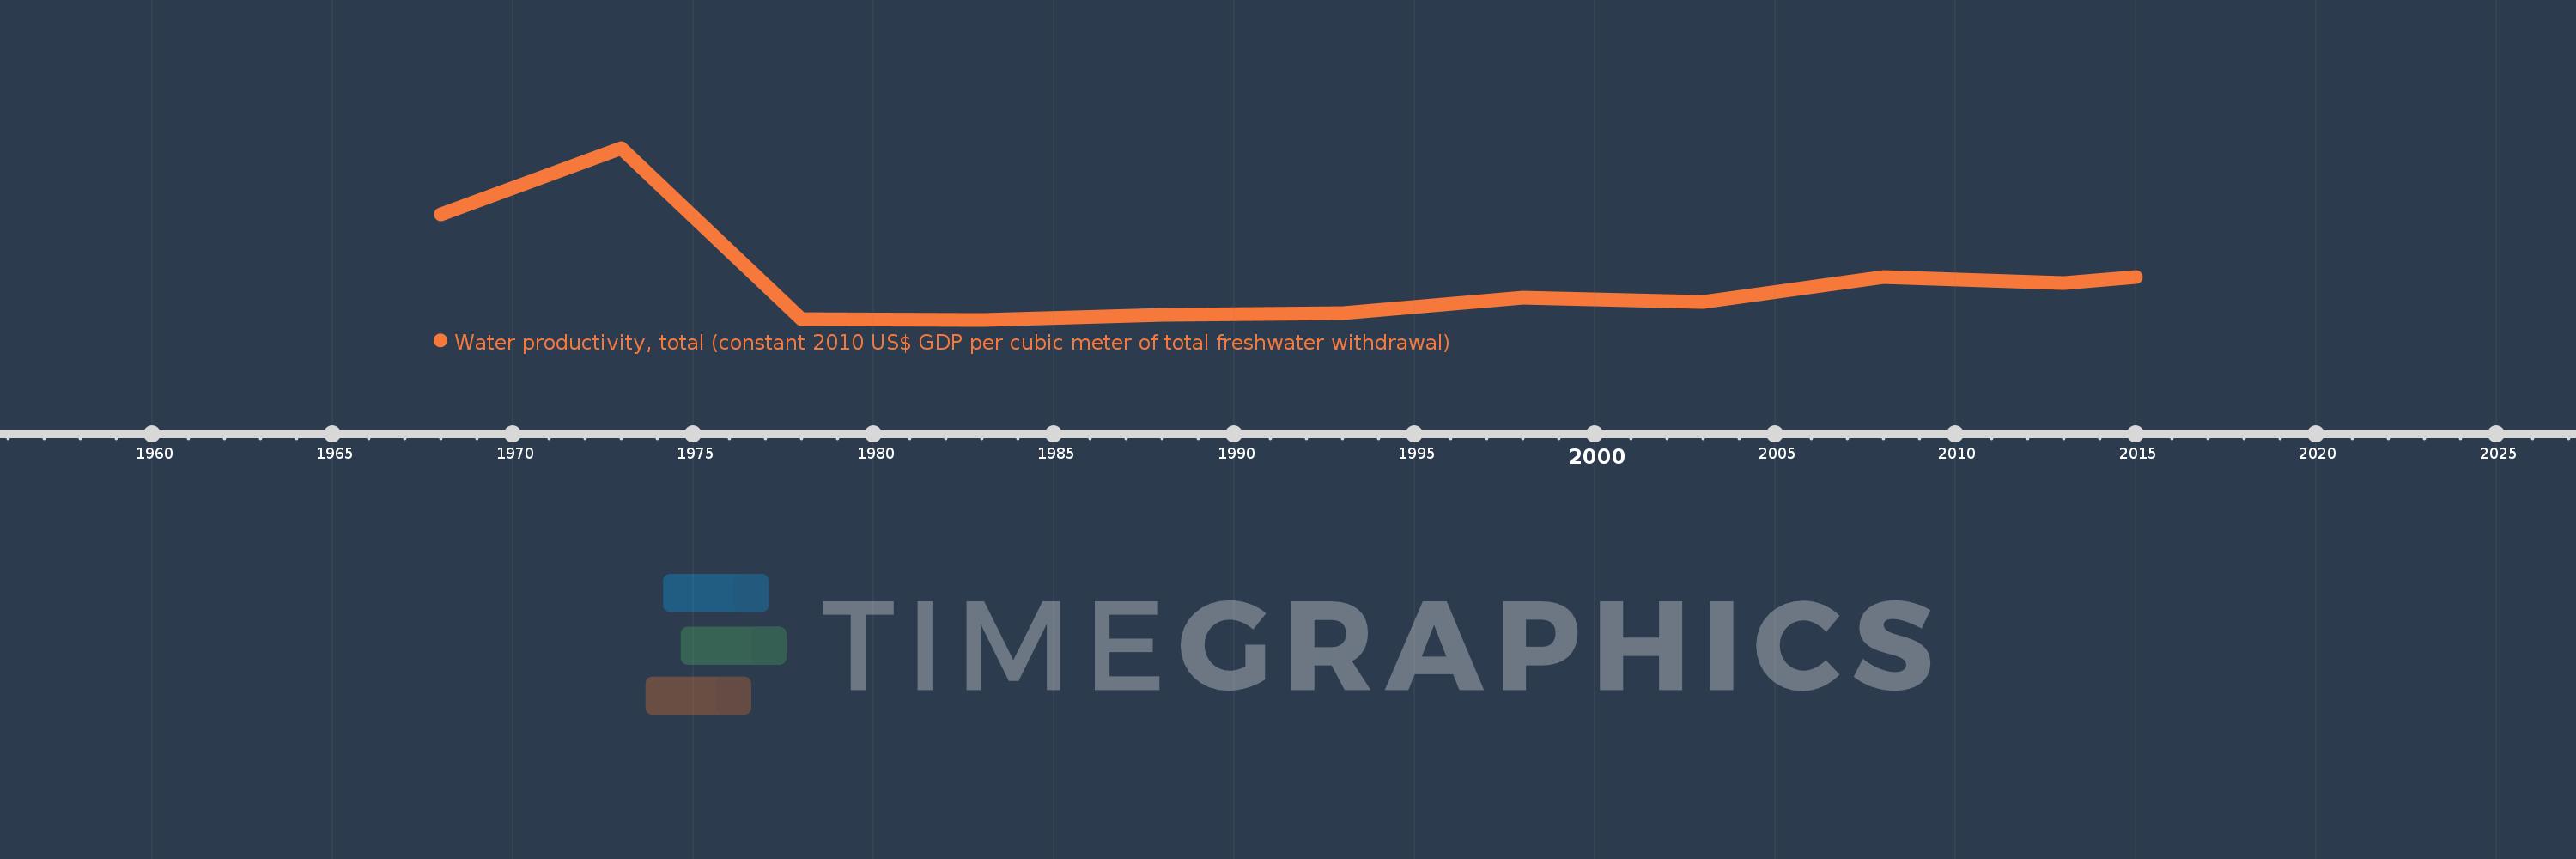
Water productivity, total (constant 2010 US$ GDP per cubic meter of total freshwater withdrawal)
2015,2013,2008,2003,1998,1993,1988,1983,1978,1973,1968
This statistics in other country:
Timeline:
This timeline shows a graph from 1968 to 2015 of IBRD only. No data until 1967. Number of actual observations by date: 11.
Source name:
World Development Indicators
Source organization:
Food and Agriculture Organization, AQUASTAT data, and World Bank and OECD GDP estimates.
Categories, topics:
Environment
Last updated:
apr 23, 2017
Indicators value changes by year
Maximum:
35.278
jan 1, 1973
At the date of observation
Value
Absolute change
Change from previous value
jan 1, 1968
22.207
+22.207
0.0%
jan 1, 1973
35.278
+13.07
58.85%
jan 1, 1978
1.637
-33.641
-95.36%
jan 1, 1983
1.445
-0.192
-11.72%
jan 1, 1988
2.353
+0.908
62.83%
jan 1, 1993
2.669
+0.316
13.42%
jan 1, 1998
5.77
+3.101
116.19%
jan 1, 2003
4.952
-0.818
-14.18%
jan 1, 2008
9.867
+4.915
99.24%
jan 1, 2013
8.742
-1.125
-11.4%
jan 1, 2015
9.791
+1.049
12.0%
Ranking of countries by current statistics by years


Comments: