29
/
en
AIzaSyAYiBZKx7MnpbEhh9jyipgxe19OcubqV5w
April 1, 2024
238869
Seychelles
SYC
true
2
1
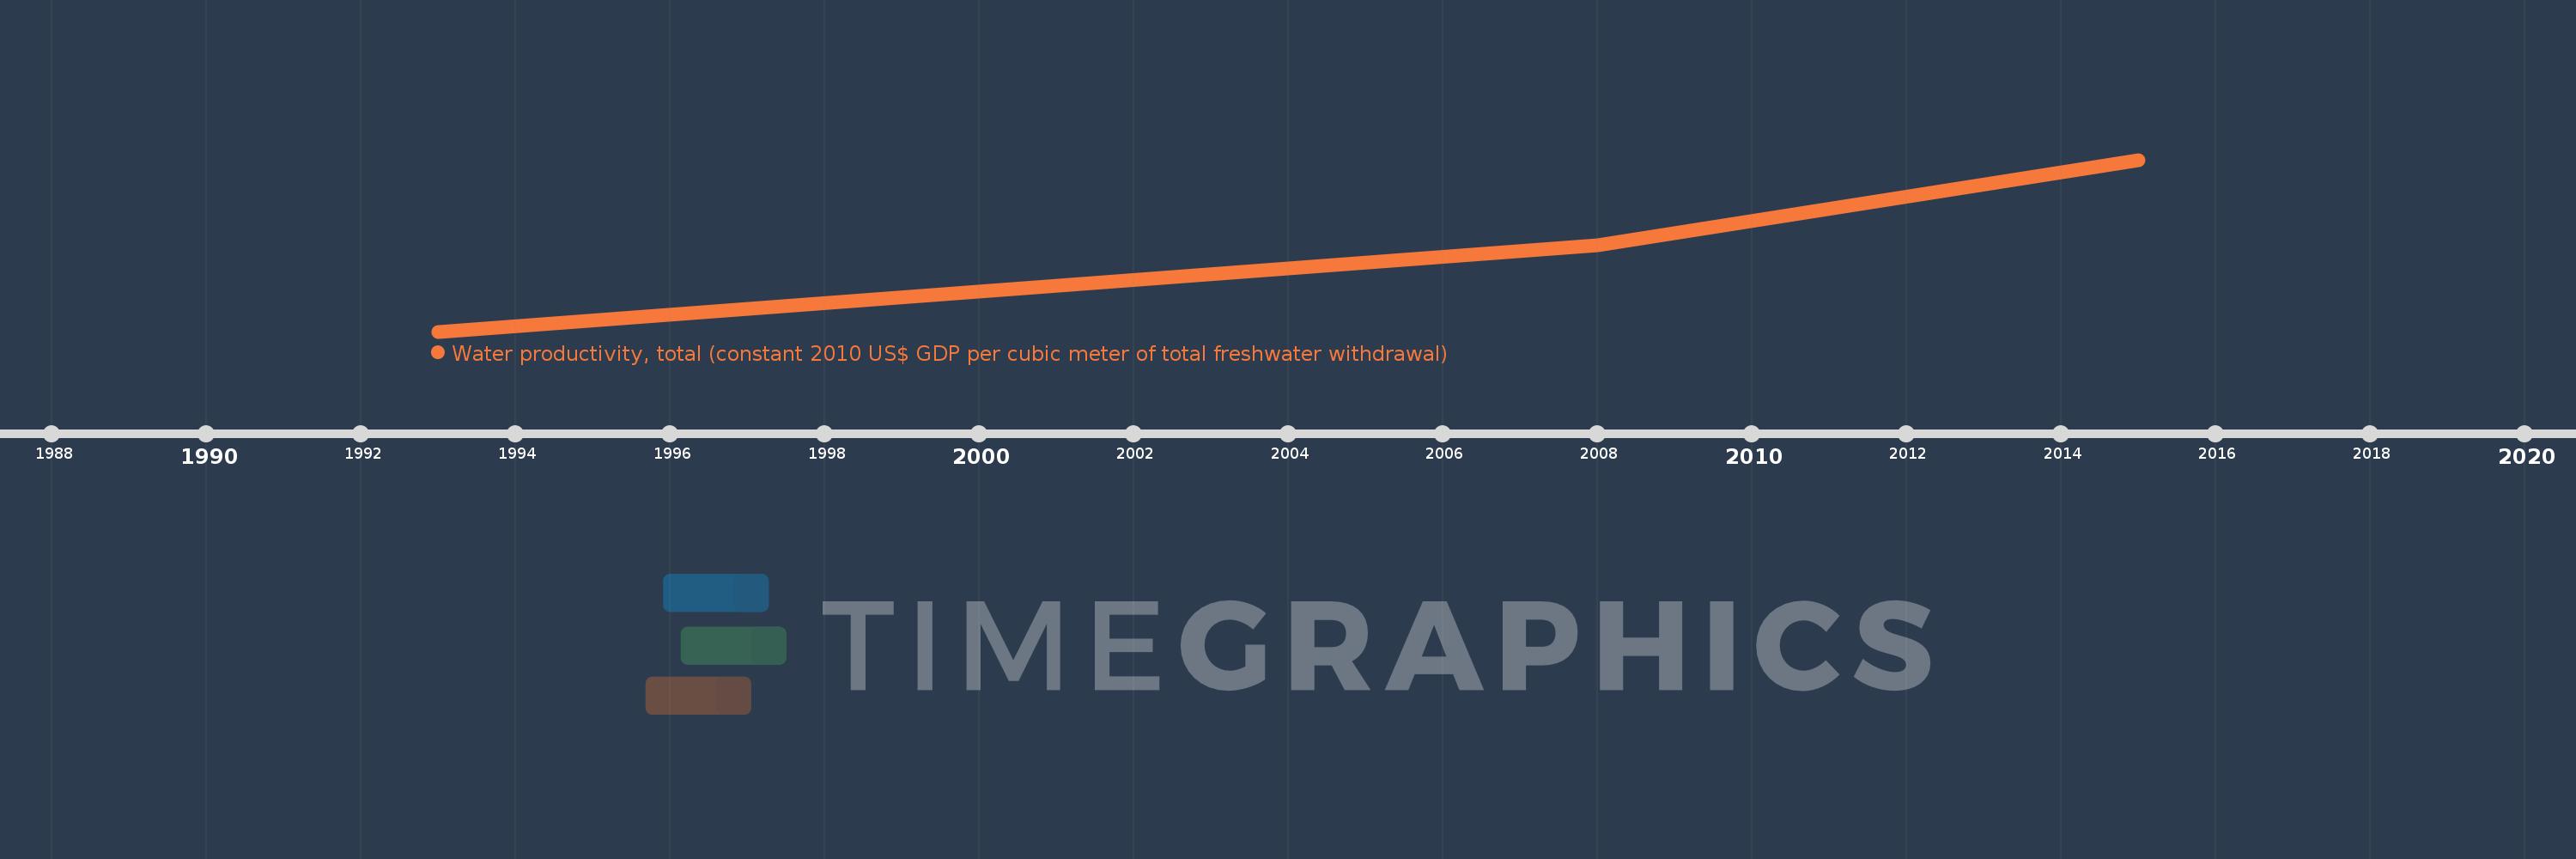
Water productivity, total (constant 2010 US$ GDP per cubic meter of total freshwater withdrawal)
2015,2008,1993
This statistics in other country:
Timeline:
This timeline shows a graph from 1993 to 2015 of Seychelles. No data until 1992. Number of actual observations by date: 3.
Source name:
World Development Indicators
Source organization:
Food and Agriculture Organization, AQUASTAT data, and World Bank and OECD GDP estimates.
Categories, topics:
Environment
Last updated:
apr 23, 2017
Indicators value changes by year
Minimum:
48.514
jan 1, 1993
Maximum:
89.222
jan 1, 2015
At the date of observation
Value
Absolute change
Change from previous value
jan 1, 1993
48.514
+48.514
0.0%
jan 1, 2008
69.048
+20.535
42.33%
jan 1, 2015
89.222
+20.174
29.22%
Ranking of countries by current statistics by years


Comments: