29
/
en
AIzaSyAYiBZKx7MnpbEhh9jyipgxe19OcubqV5w
April 1, 2024
33177
Europe & Central Asia (IDA & IBRD countries)
TEC
false
2
1
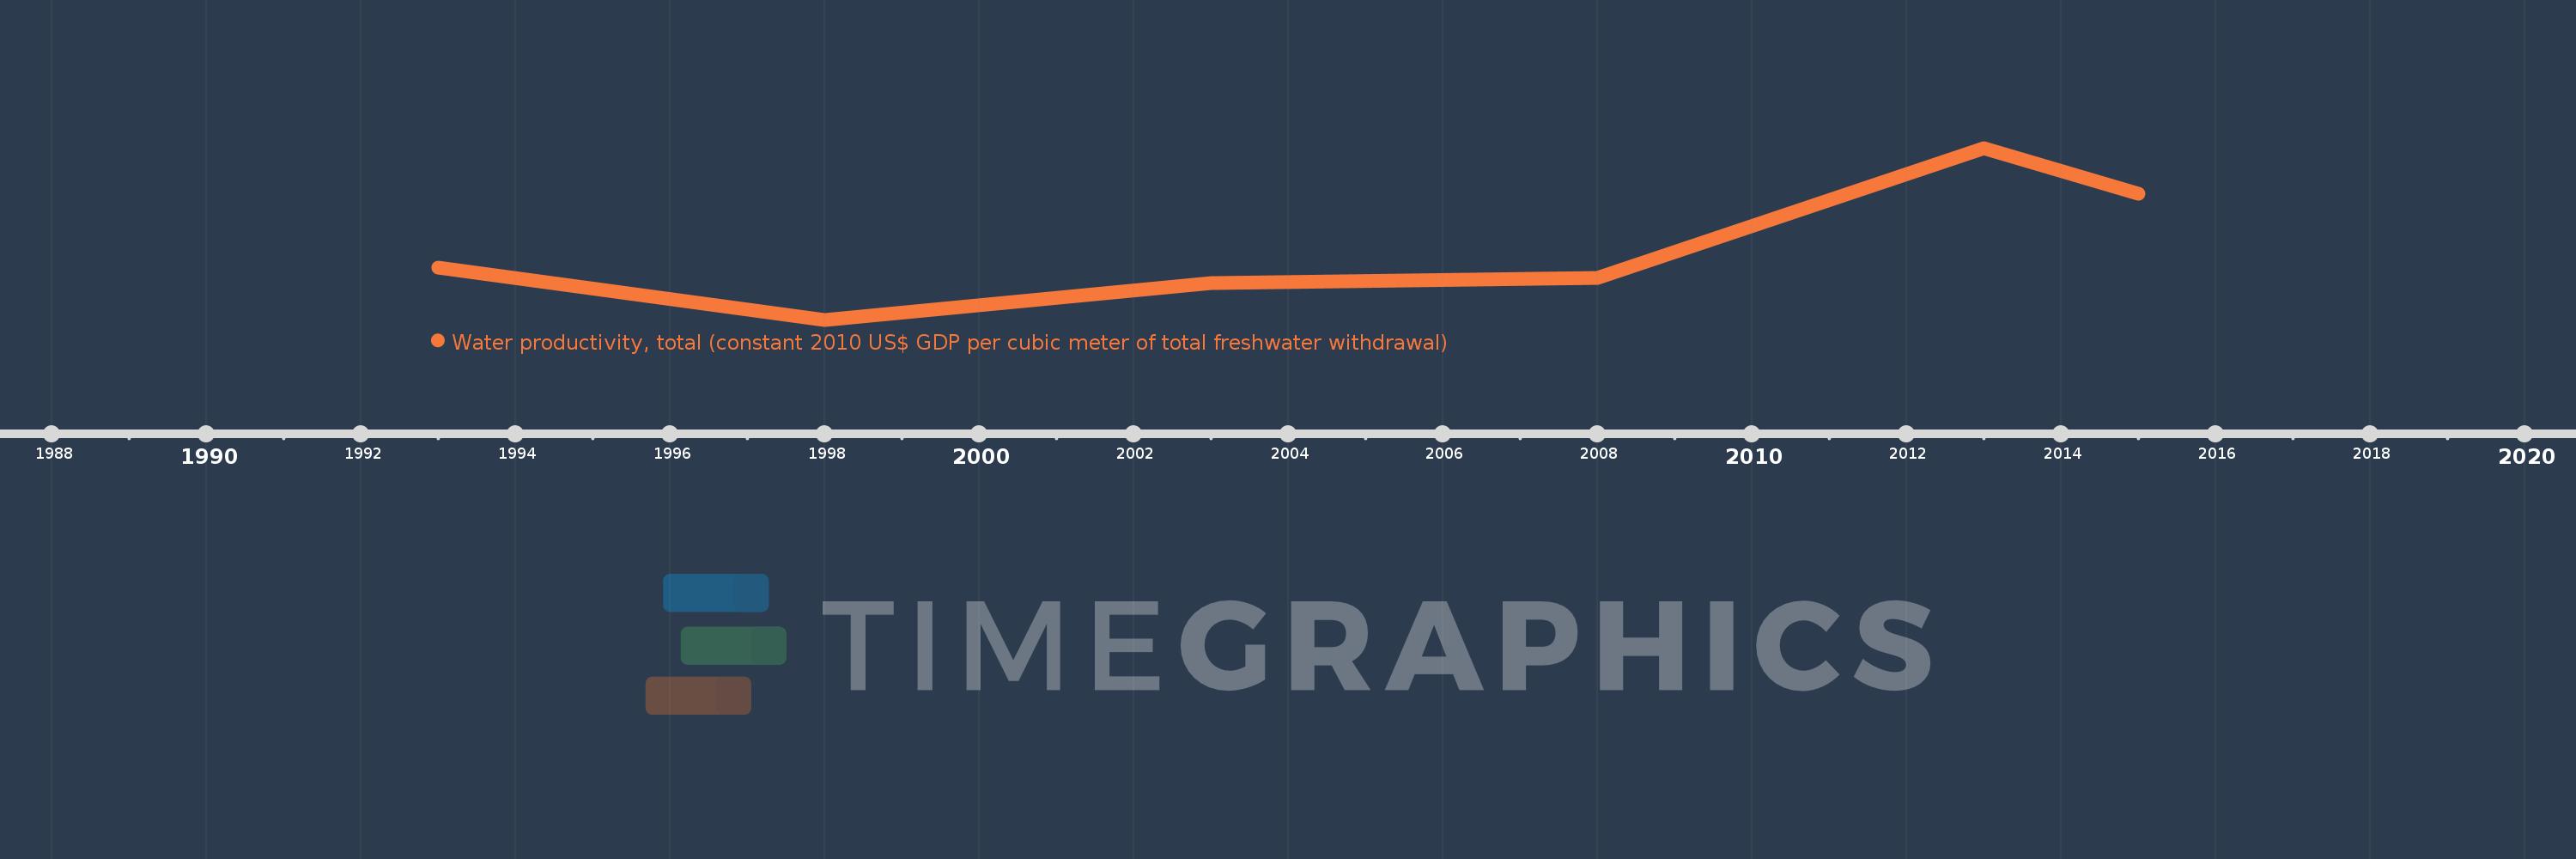
Water productivity, total (constant 2010 US$ GDP per cubic meter of total freshwater withdrawal)
2015,2013,2008,2003,1998,1993
This statistics in other country:
Timeline:
This timeline shows a graph from 1993 to 2015 of Europe & Central Asia (IDA & IBRD countries). No data until 1992. Number of actual observations by date: 6.
Source name:
World Development Indicators
Source organization:
Food and Agriculture Organization, AQUASTAT data, and World Bank and OECD GDP estimates.
Categories, topics:
Environment
Last updated:
apr 23, 2017
Indicators value changes by year
Maximum:
16.904
jan 1, 2013
At the date of observation
Value
Absolute change
Change from previous value
jan 1, 1993
8.893
+8.893
0.0%
jan 1, 1998
5.363
-3.53
-39.7%
jan 1, 2003
7.852
+2.49
46.42%
jan 1, 2008
8.146
+0.294
3.74%
jan 1, 2013
16.904
+8.757
107.51%
jan 1, 2015
13.809
-3.094
-18.3%
Ranking of countries by current statistics by years


Comments: