29
/
en
AIzaSyAYiBZKx7MnpbEhh9jyipgxe19OcubqV5w
April 1, 2024
225539
Poland
POL
true
2
1
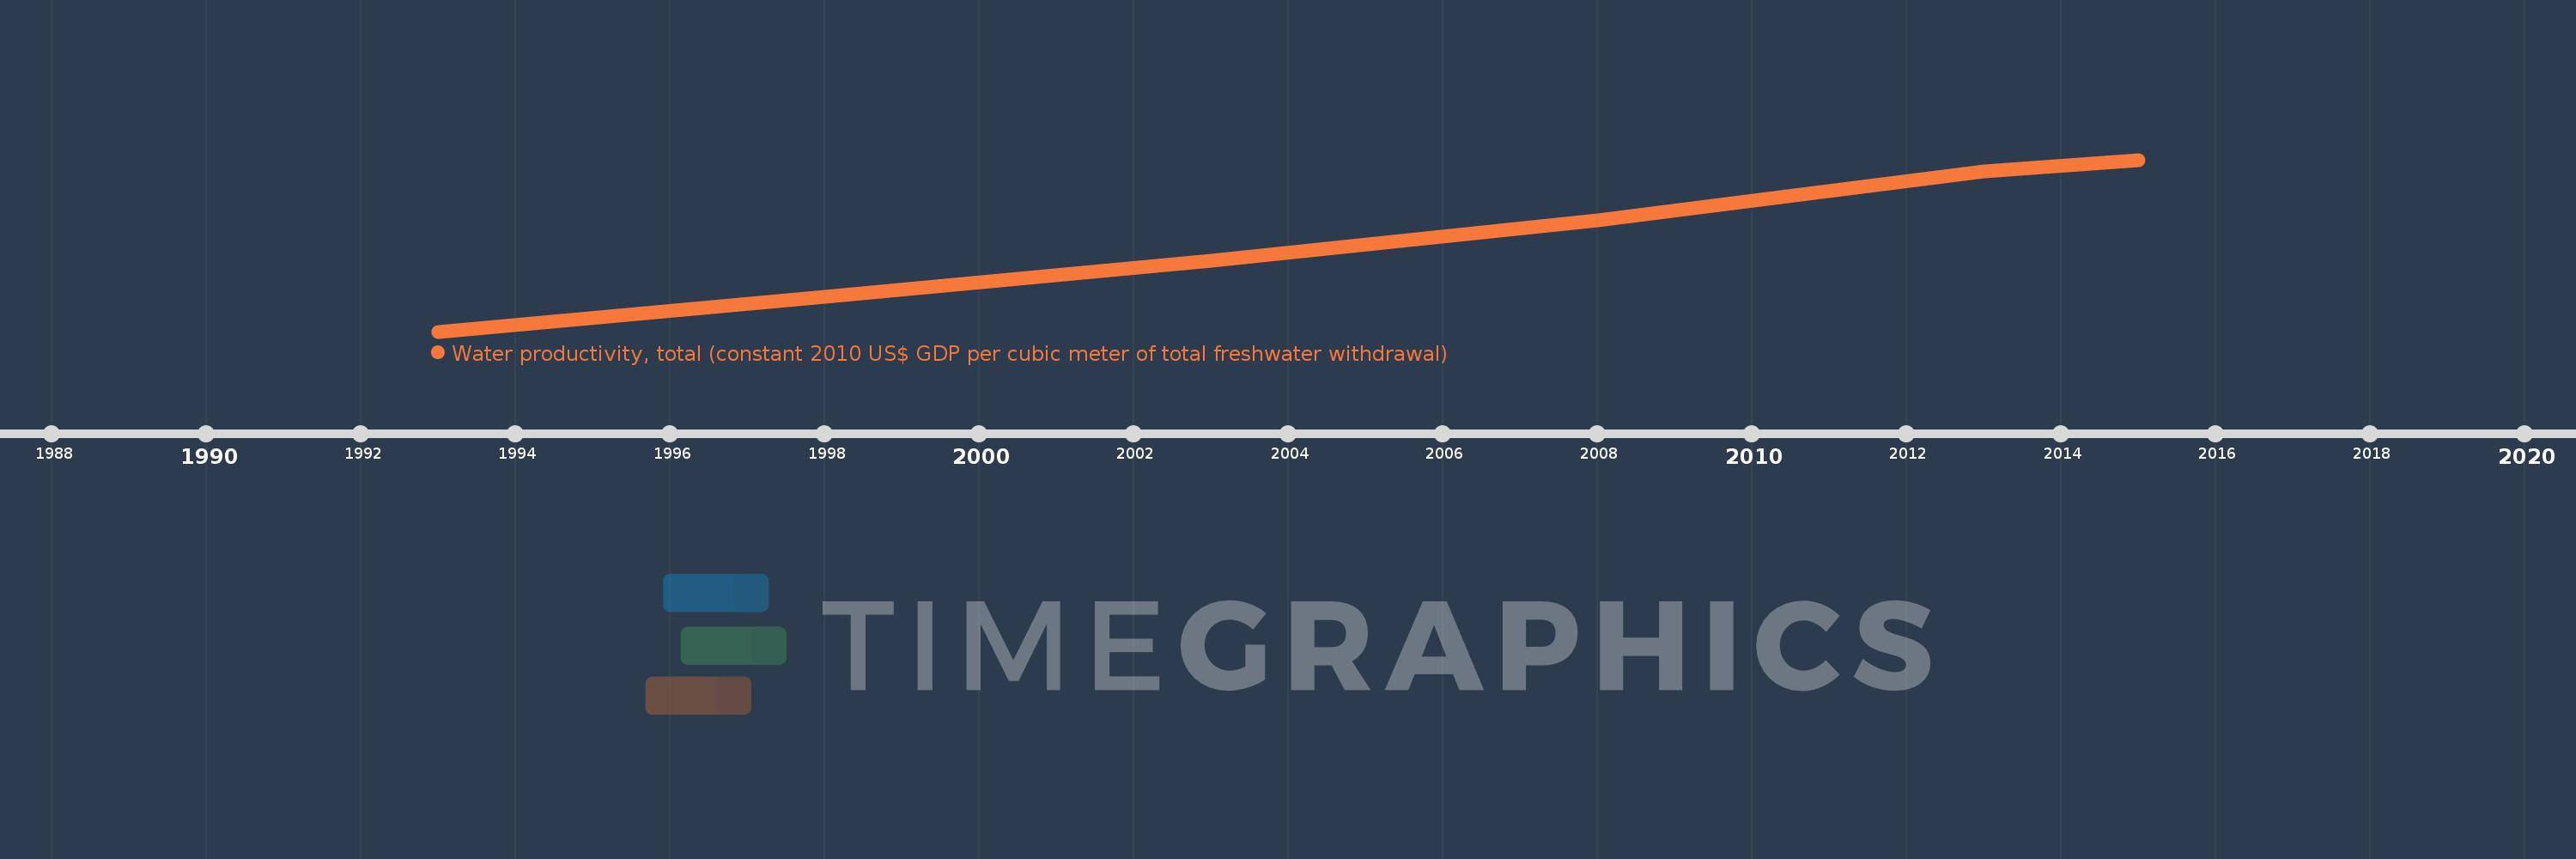
Water productivity, total (constant 2010 US$ GDP per cubic meter of total freshwater withdrawal)
2015,2013,2008,2003,1998,1993
This statistics in other country:
Timeline:
This timeline shows a graph from 1993 to 2015 of Poland. No data until 1992. Number of actual observations by date: 6.
Source name:
World Development Indicators
Source organization:
Food and Agriculture Organization, AQUASTAT data, and World Bank and OECD GDP estimates.
Categories, topics:
Environment
Last updated:
apr 23, 2017
Indicators value changes by year
Minimum:
16.136
jan 1, 1993
Maximum:
46.654
jan 1, 2015
At the date of observation
Value
Absolute change
Change from previous value
jan 1, 1993
16.136
+16.136
0.0%
jan 1, 1998
22.265
+6.129
37.98%
jan 1, 2003
28.731
+6.467
29.04%
jan 1, 2008
35.877
+7.146
24.87%
jan 1, 2013
44.552
+8.675
24.18%
jan 1, 2015
46.654
+2.102
4.72%
Ranking of countries by current statistics by years


Comments: