29
/
en
AIzaSyAYiBZKx7MnpbEhh9jyipgxe19OcubqV5w
April 1, 2024
53354
Other small states
OSS
false
2
1
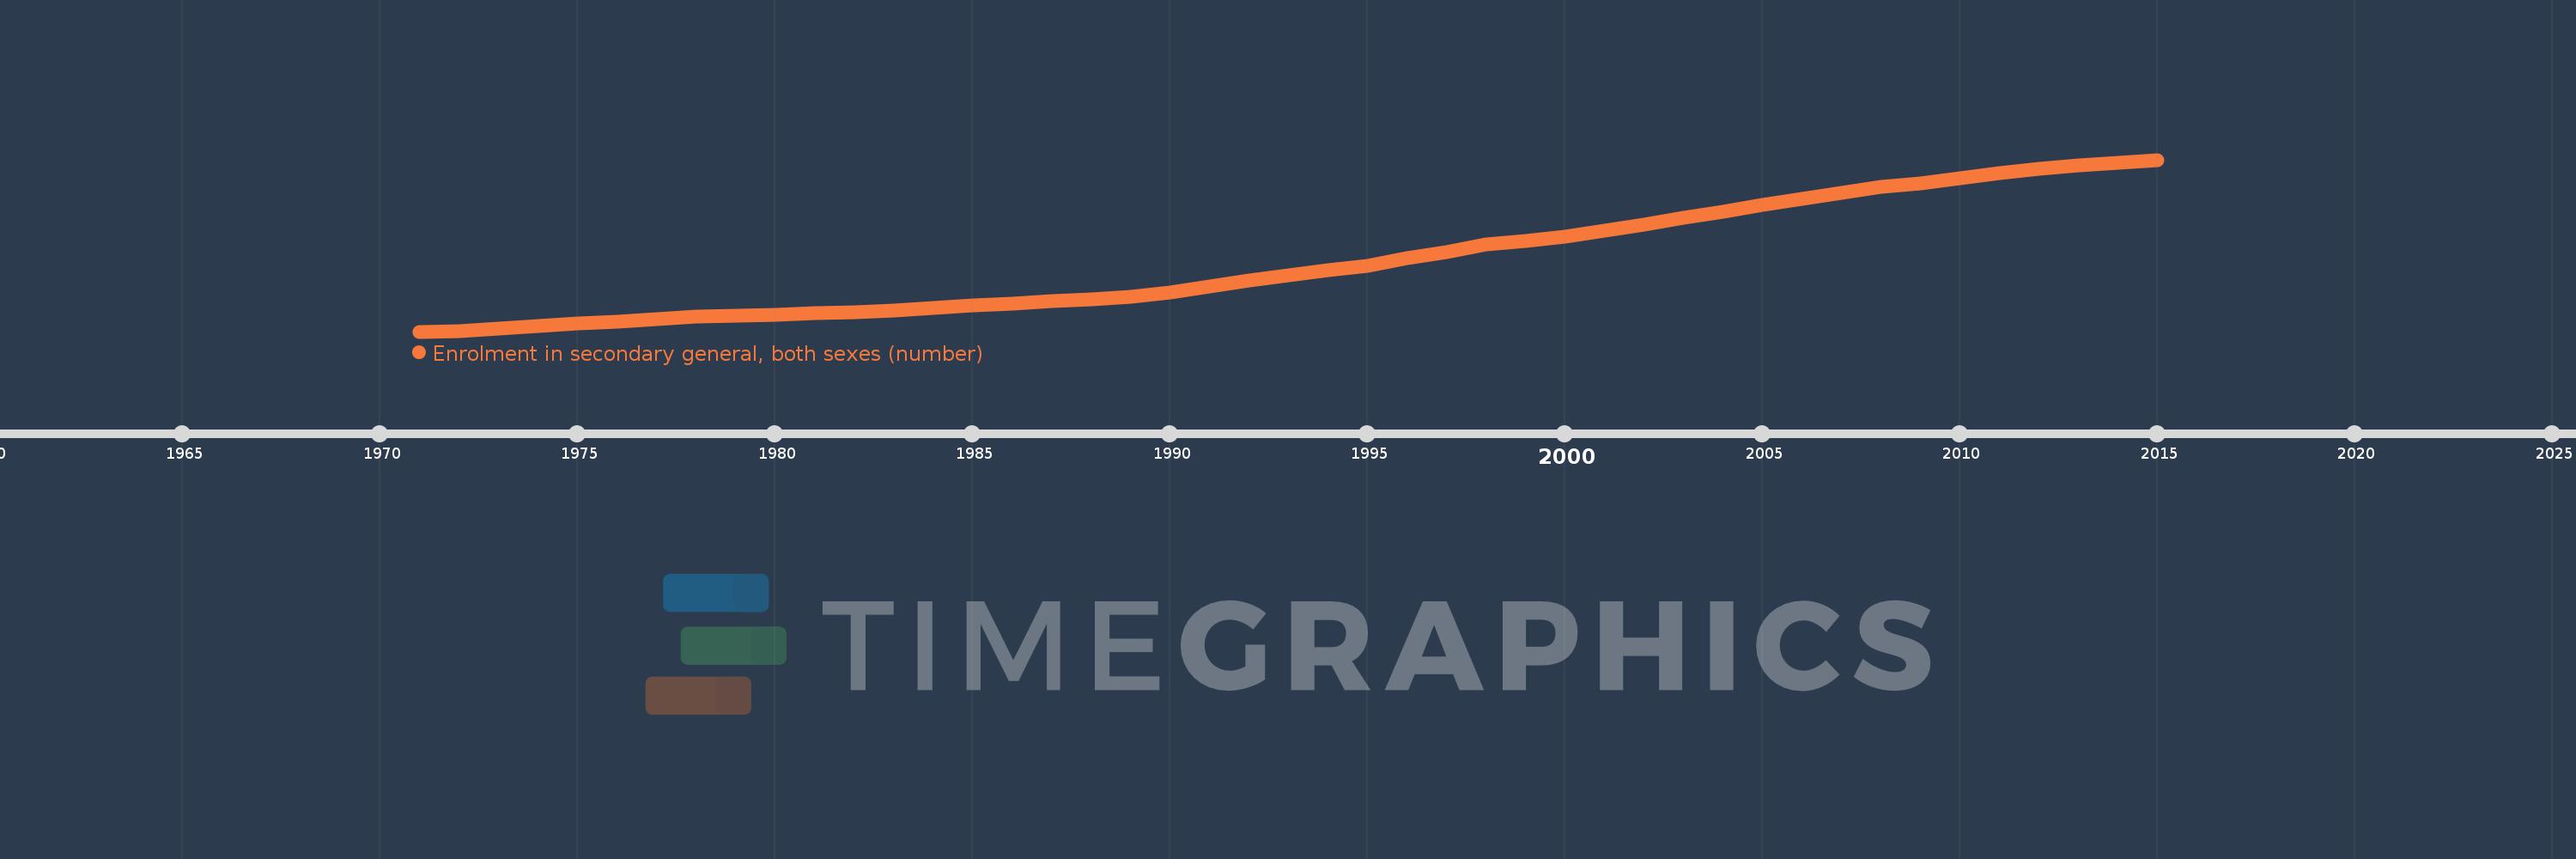
Enrolment in secondary general, both sexes (number)
2015,2014,2013,2012,2011,2010,2009,2008,2007,2006,2005,2004,2003,2002,2001,2000,1999,1998,1997,1996,1995,1994,1993,1992,1991,1990,1989,1988,1987,1986,1985,1984,1983,1982,1981,1980,1979,1978,1977,1976,1975,1974,1973,1972,1971
This statistics in other country:
AfghanistanAlbaniaAlgeriaAmerican SamoaAndorraAngolaAntigua and BarbudaArab WorldArgentinaArmeniaArubaAustraliaAustriaAzerbaijanBahamas, TheBahrainBangladeshBarbadosBelarusBelgiumBelizeBeninBermudaBhutanBoliviaBosnia and HerzegovinaBotswanaBrazilBritish Virgin IslandsBrunei DarussalamBulgariaBurkina FasoBurundiCabo VerdeCambodiaCameroonCanadaCaribbean small statesCayman IslandsCentral African RepublicCentral Europe and the BalticsChadChileChinaColombiaComorosCongo, Dem. Rep.Congo, Rep.Costa RicaCote d'IvoireCroatiaCubaCuracaoCyprusCzech RepublicDenmarkDjiboutiDominicaDominican RepublicEarly-demographic dividendEast Asia & PacificEast Asia & Pacific (excluding high income)East Asia & Pacific (IDA & IBRD countries)EcuadorEgypt, Arab Rep.El SalvadorEquatorial GuineaEritreaEstoniaEthiopiaEuro areaEurope & Central AsiaEurope & Central Asia (excluding high income)Europe & Central Asia (IDA & IBRD countries)European UnionFaroe IslandsFijiFinlandFragile and conflict affected situationsFranceFrench PolynesiaGabonGambia, TheGeorgiaGermanyGhanaGibraltarGreeceGrenadaGuamGuatemalaGuineaGuinea-BissauGuyanaHaitiHeavily indebted poor countries (HIPC)High incomeHondurasHong Kong SAR, ChinaHungaryIBRD onlyIcelandIDA & IBRD totalIDA blendIDA onlyIDA totalIndiaIndonesiaIran, Islamic Rep.IraqIrelandIsraelItalyJamaicaJapanJordanKazakhstanKenyaKiribatiKorea, Dem. People’s Rep.Korea, Rep.KuwaitKyrgyz RepublicLao PDRLate-demographic dividendLatin America & Caribbean Latin America & Caribbean (excluding high income)Latin America & the Caribbean (IDA & IBRD countries)LatviaLeast developed countries: UN classificationLebanonLesothoLiberiaLibyaLiechtensteinLithuaniaLow & middle incomeLow incomeLower middle incomeLuxembourgMacao SAR, ChinaMacedonia, FYRMadagascarMalawiMalaysiaMaldivesMaliMaltaMarshall IslandsMauritaniaMauritiusMexicoMicronesia, Fed. Sts.Middle East & North AfricaMiddle East & North Africa (excluding high income)Middle East & North Africa (IDA & IBRD countries)Middle incomeMoldovaMonacoMongoliaMontenegroMoroccoMozambiqueMyanmarNamibiaNauruNepalNetherlandsNew CaledoniaNew ZealandNicaraguaNigerNigeriaNorth AmericaNorwayOECD membersOmanOther small statesPacific island small statesPakistanPalauPanamaPapua New GuineaParaguayPeruPhilippinesPolandPortugalPost-demographic dividendPre-demographic dividendPuerto RicoQatarRomaniaRussian FederationRwandaSamoaSan MarinoSao Tome and PrincipeSaudi ArabiaSenegalSerbiaSeychellesSierra LeoneSingaporeSint Maarten (Dutch part)Slovak RepublicSloveniaSmall statesSolomon IslandsSomaliaSouth AfricaSouth AsiaSouth Asia (IDA & IBRD)South SudanSpainSri LankaSt. Kitts and NevisSt. LuciaSt. Vincent and the GrenadinesSub-Saharan Africa Sub-Saharan Africa (excluding high income)Sub-Saharan Africa (IDA & IBRD countries)SudanSurinameSwazilandSwedenSwitzerlandSyrian Arab RepublicTajikistanTanzaniaThailandTimor-LesteTogoTongaTrinidad and TobagoTunisiaTurkeyTurkmenistanTurks and Caicos IslandsTuvaluUgandaUkraineUnited Arab EmiratesUnited KingdomUnited StatesUpper middle incomeUruguayUzbekistanVanuatuVenezuela, RBVietnamVirgin Islands (U.S.)West Bank and GazaWorldYemen, Rep.ZambiaZimbabwe Timeline:
This timeline shows a graph from 1971 to 2015 of Other small states. No data until 1970. Number of actual observations by date: 45.
Source name:
World Development Indicators
Source organization:
UNESCO Institute for Statistics
Categories, topics:
Education
Last updated:
apr 23, 2017
Indicators value changes by year
Minimum:
402.758K
jan 1, 1971
Maximum:
1.886 mln
jan 1, 2015
At the date of observation
Value
Absolute change
Change from previous value
jan 1, 1971
402.758K
+402.758K
0.0%
jan 1, 1972
403.866K
+1.107K
0.27%
jan 1, 1973
426.983K
+23.118K
5.72%
jan 1, 1974
453.027K
+26.043K
6.1%
jan 1, 1975
473.68K
+20.654K
4.56%
jan 1, 1976
490.392K
+16.712K
3.53%
jan 1, 1977
510.205K
+19.813K
4.04%
jan 1, 1978
531.107K
+20.902K
4.1%
jan 1, 1979
539.869K
+8.761K
1.65%
jan 1, 1980
550.322K
+10.453K
1.94%
jan 1, 1981
559.104K
+8.782K
1.6%
jan 1, 1982
568.208K
+9.104K
1.63%
jan 1, 1983
584.361K
+16.154K
2.84%
jan 1, 1984
606.949K
+22.587K
3.87%
jan 1, 1985
627.954K
+21.005K
3.46%
jan 1, 1986
646.515K
+18.561K
2.96%
jan 1, 1987
665.681K
+19.166K
2.96%
jan 1, 1988
684.384K
+18.704K
2.81%
jan 1, 1989
705.797K
+21.413K
3.13%
jan 1, 1990
739.183K
+33.386K
4.73%
jan 1, 1991
789.603K
+50.42K
6.82%
jan 1, 1992
846.025K
+56.422K
7.15%
jan 1, 1993
886.93K
+40.904K
4.83%
jan 1, 1994
931.999K
+45.07K
5.08%
jan 1, 1995
972.403K
+40.403K
4.34%
jan 1, 1996
1.036 mln
+63.415K
6.52%
jan 1, 1997
1.091 mln
+55.046K
5.31%
jan 1, 1998
1.152 mln
+61.193K
5.61%
jan 1, 1999
1.182 mln
+29.721K
2.58%
jan 1, 2000
1.224 mln
+42.675K
3.61%
jan 1, 2001
1.276 mln
+51.544K
4.21%
jan 1, 2002
1.329 mln
+53.353K
4.18%
jan 1, 2003
1.383 mln
+54.011K
4.06%
jan 1, 2004
1.439 mln
+55.292K
4.0%
jan 1, 2005
1.5 mln
+61.269K
4.26%
jan 1, 2006
1.55 mln
+49.986K
3.33%
jan 1, 2007
1.603 mln
+52.981K
3.42%
jan 1, 2008
1.651 mln
+48.371K
3.02%
jan 1, 2009
1.682 mln
+30.881K
1.87%
jan 1, 2010
1.728 mln
+45.502K
2.71%
jan 1, 2011
1.767 mln
+39.611K
2.29%
jan 1, 2012
1.807 mln
+39.378K
2.23%
jan 1, 2013
1.837 mln
+30.023K
1.66%
jan 1, 2014
1.858 mln
+21.396K
1.16%
jan 1, 2015
1.886 mln
+27.705K
1.49%
Ranking of countries by current statistics by years


Comments: