29
/
en
AIzaSyAYiBZKx7MnpbEhh9jyipgxe19OcubqV5w
April 1, 2024
243538
Solomon Islands
SLB
true
2
1
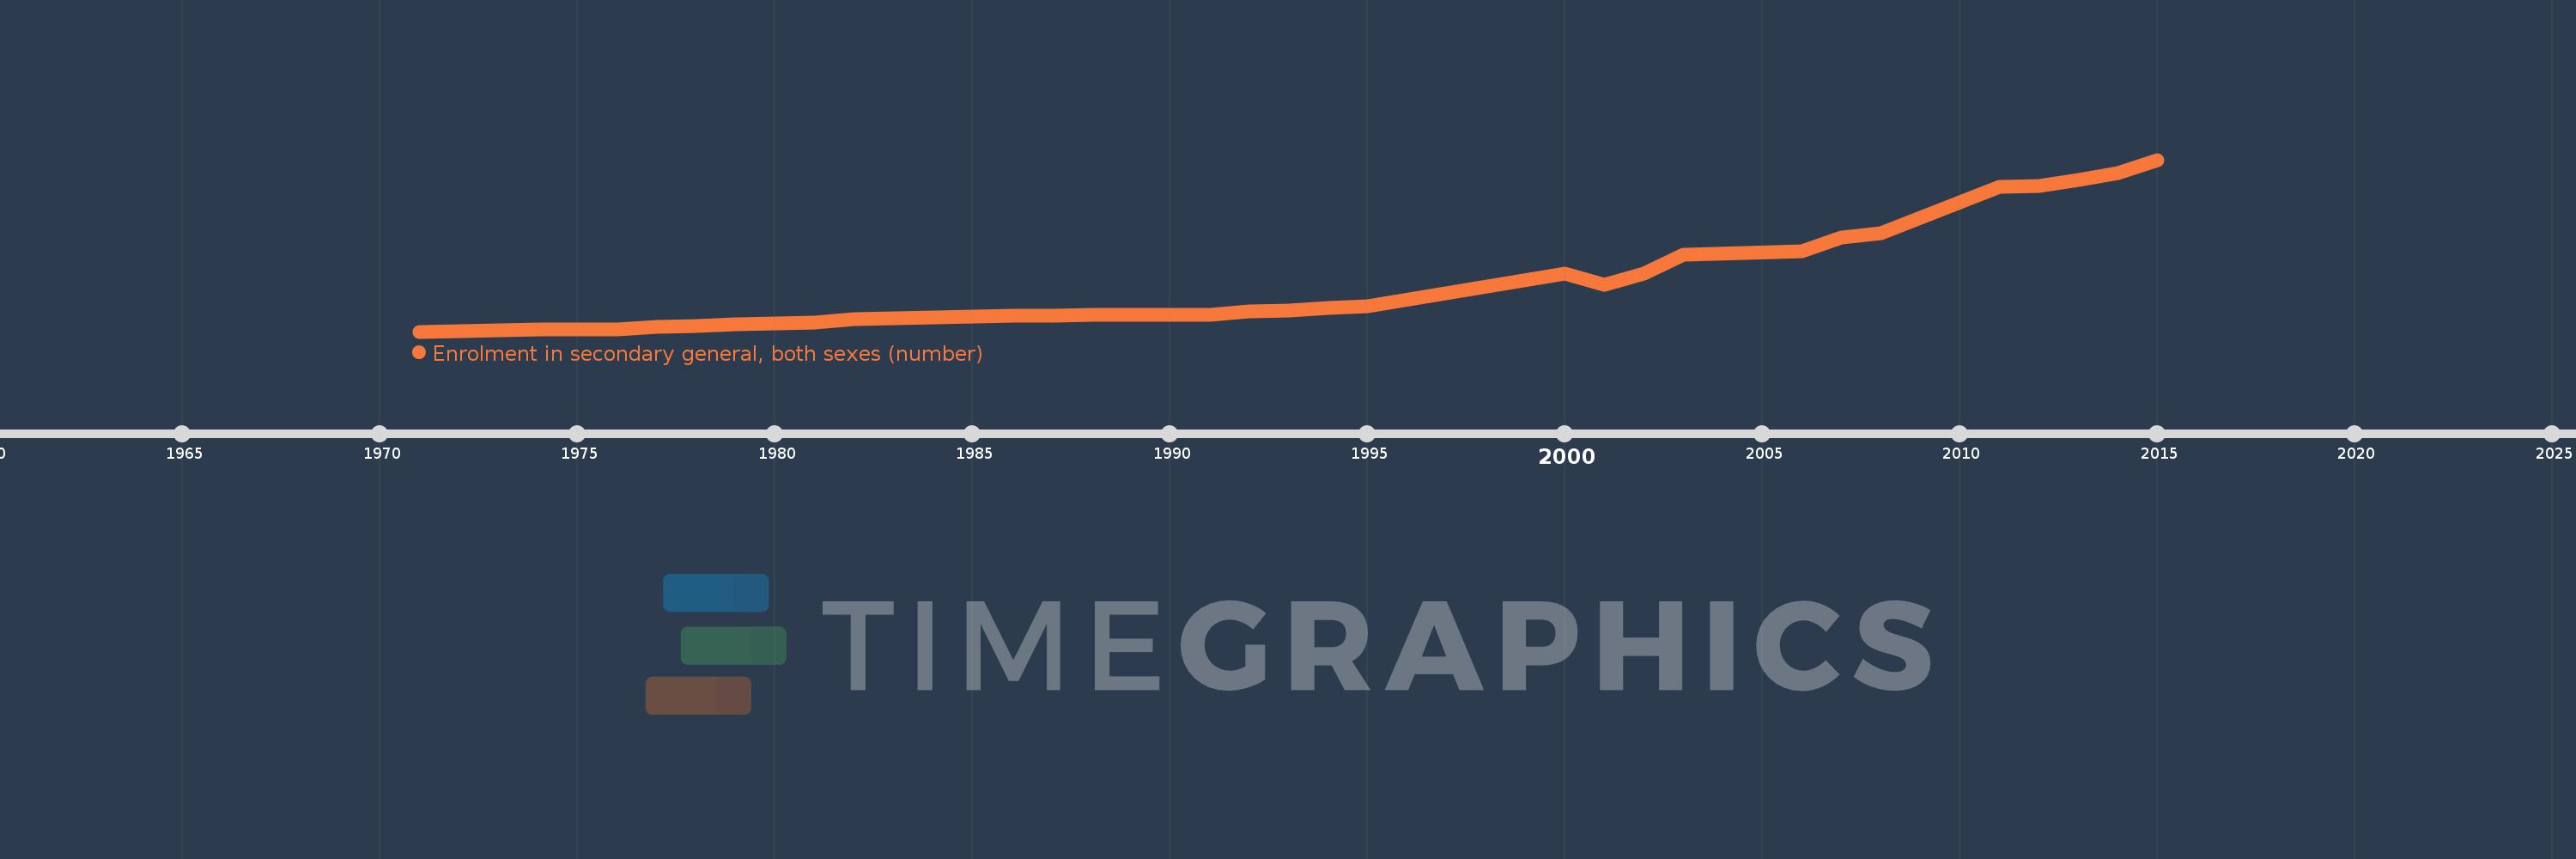
Enrolment in secondary general, both sexes (number)
2015,2014,2013,2012,2011,2008,2007,2006,2003,2002,2001,2000,1995,1994,1993,1992,1991,1988,1987,1986,1985,1984,1983,1982,1981,1980,1979,1978,1977,1976,1975,1974,1973,1972,1971
This statistics in other country:
AfghanistanAlbaniaAlgeriaAmerican SamoaAndorraAngolaAntigua and BarbudaArab WorldArgentinaArmeniaArubaAustraliaAustriaAzerbaijanBahamas, TheBahrainBangladeshBarbadosBelarusBelgiumBelizeBeninBermudaBhutanBoliviaBosnia and HerzegovinaBotswanaBrazilBritish Virgin IslandsBrunei DarussalamBulgariaBurkina FasoBurundiCabo VerdeCambodiaCameroonCanadaCaribbean small statesCayman IslandsCentral African RepublicCentral Europe and the BalticsChadChileChinaColombiaComorosCongo, Dem. Rep.Congo, Rep.Costa RicaCote d'IvoireCroatiaCubaCuracaoCyprusCzech RepublicDenmarkDjiboutiDominicaDominican RepublicEarly-demographic dividendEast Asia & PacificEast Asia & Pacific (excluding high income)East Asia & Pacific (IDA & IBRD countries)EcuadorEgypt, Arab Rep.El SalvadorEquatorial GuineaEritreaEstoniaEthiopiaEuro areaEurope & Central AsiaEurope & Central Asia (excluding high income)Europe & Central Asia (IDA & IBRD countries)European UnionFaroe IslandsFijiFinlandFragile and conflict affected situationsFranceFrench PolynesiaGabonGambia, TheGeorgiaGermanyGhanaGibraltarGreeceGrenadaGuamGuatemalaGuineaGuinea-BissauGuyanaHaitiHeavily indebted poor countries (HIPC)High incomeHondurasHong Kong SAR, ChinaHungaryIBRD onlyIcelandIDA & IBRD totalIDA blendIDA onlyIDA totalIndiaIndonesiaIran, Islamic Rep.IraqIrelandIsraelItalyJamaicaJapanJordanKazakhstanKenyaKiribatiKorea, Dem. People’s Rep.Korea, Rep.KuwaitKyrgyz RepublicLao PDRLate-demographic dividendLatin America & Caribbean Latin America & Caribbean (excluding high income)Latin America & the Caribbean (IDA & IBRD countries)LatviaLeast developed countries: UN classificationLebanonLesothoLiberiaLibyaLiechtensteinLithuaniaLow & middle incomeLow incomeLower middle incomeLuxembourgMacao SAR, ChinaMacedonia, FYRMadagascarMalawiMalaysiaMaldivesMaliMaltaMarshall IslandsMauritaniaMauritiusMexicoMicronesia, Fed. Sts.Middle East & North AfricaMiddle East & North Africa (excluding high income)Middle East & North Africa (IDA & IBRD countries)Middle incomeMoldovaMonacoMongoliaMontenegroMoroccoMozambiqueMyanmarNamibiaNauruNepalNetherlandsNew CaledoniaNew ZealandNicaraguaNigerNigeriaNorth AmericaNorwayOECD membersOmanOther small statesPacific island small statesPakistanPalauPanamaPapua New GuineaParaguayPeruPhilippinesPolandPortugalPost-demographic dividendPre-demographic dividendPuerto RicoQatarRomaniaRussian FederationRwandaSamoaSan MarinoSao Tome and PrincipeSaudi ArabiaSenegalSerbiaSeychellesSierra LeoneSingaporeSint Maarten (Dutch part)Slovak RepublicSloveniaSmall statesSolomon IslandsSomaliaSouth AfricaSouth AsiaSouth Asia (IDA & IBRD)South SudanSpainSri LankaSt. Kitts and NevisSt. LuciaSt. Vincent and the GrenadinesSub-Saharan Africa Sub-Saharan Africa (excluding high income)Sub-Saharan Africa (IDA & IBRD countries)SudanSurinameSwazilandSwedenSwitzerlandSyrian Arab RepublicTajikistanTanzaniaThailandTimor-LesteTogoTongaTrinidad and TobagoTunisiaTurkeyTurkmenistanTurks and Caicos IslandsTuvaluUgandaUkraineUnited Arab EmiratesUnited KingdomUnited StatesUpper middle incomeUruguayUzbekistanVanuatuVenezuela, RBVietnamVirgin Islands (U.S.)West Bank and GazaWorldYemen, Rep.ZambiaZimbabwe Timeline:
This timeline shows a graph from 1971 to 2015 of Solomon Islands. No data until 1970. Number of actual observations by date: 35.
Source name:
World Development Indicators
Source organization:
UNESCO Institute for Statistics
Categories, topics:
Education
Last updated:
apr 23, 2017
Indicators value changes by year
Minimum:
1.042K
jan 1, 1971
Maximum:
47.05K
jan 1, 2015
At the date of observation
Value
Absolute change
Change from previous value
jan 1, 1971
1.042K
+1.042K
0.0%
jan 1, 1972
1.155K
+113.0
10.84%
jan 1, 1973
1.303K
+148.0
12.81%
jan 1, 1974
1.526K
+223.0
17.11%
jan 1, 1975
1.625K
+99.0
6.49%
jan 1, 1976
1.555K
-70.0
-4.31%
jan 1, 1977
2.244K
+689.0
44.31%
jan 1, 1978
2.635K
+391.0
17.42%
jan 1, 1979
2.984K
+349.0
13.24%
jan 1, 1980
3.189K
+205.0
6.87%
jan 1, 1981
3.547K
+358.0
11.23%
jan 1, 1982
4.265K
+718.0
20.24%
jan 1, 1983
4.594K
+329.0
7.71%
jan 1, 1984
4.807K
+213.0
4.64%
jan 1, 1985
5.118K
+311.0
6.47%
jan 1, 1986
5.24K
+122.0
2.38%
jan 1, 1987
5.336K
+96.0
1.83%
jan 1, 1988
5.607K
+271.0
5.08%
jan 1, 1991
5.636K
+29.0
0.52%
jan 1, 1992
6.363K
+727.0
12.9%
jan 1, 1993
6.666K
+303.0
4.76%
jan 1, 1994
7.351K
+685.0
10.28%
jan 1, 1995
7.811K
+460.0
6.26%
jan 1, 2000
16.576K
+8.765K
112.21%
jan 1, 2001
13.527K
-3.049K
-18.39%
jan 1, 2002
16.48K
+2.953K
21.83%
jan 1, 2003
21.7K
+5.22K
31.67%
jan 1, 2006
22.487K
+787.0
3.63%
jan 1, 2007
26.345K
+3.858K
17.16%
jan 1, 2008
27.332K
+987.0
3.75%
jan 1, 2011
39.706K
+12.374K
45.27%
jan 1, 2012
40.124K
+418.0
1.05%
jan 1, 2013
41.66K
+1.536K
3.83%
jan 1, 2014
43.574K
+1.914K
4.59%
jan 1, 2015
47.05K
+3.476K
7.98%
Ranking of countries by current statistics by years


Comments: