29
/
en
AIzaSyAYiBZKx7MnpbEhh9jyipgxe19OcubqV5w
April 1, 2024
34910
Heavily indebted poor countries (HIPC)
HPC
false
2
1
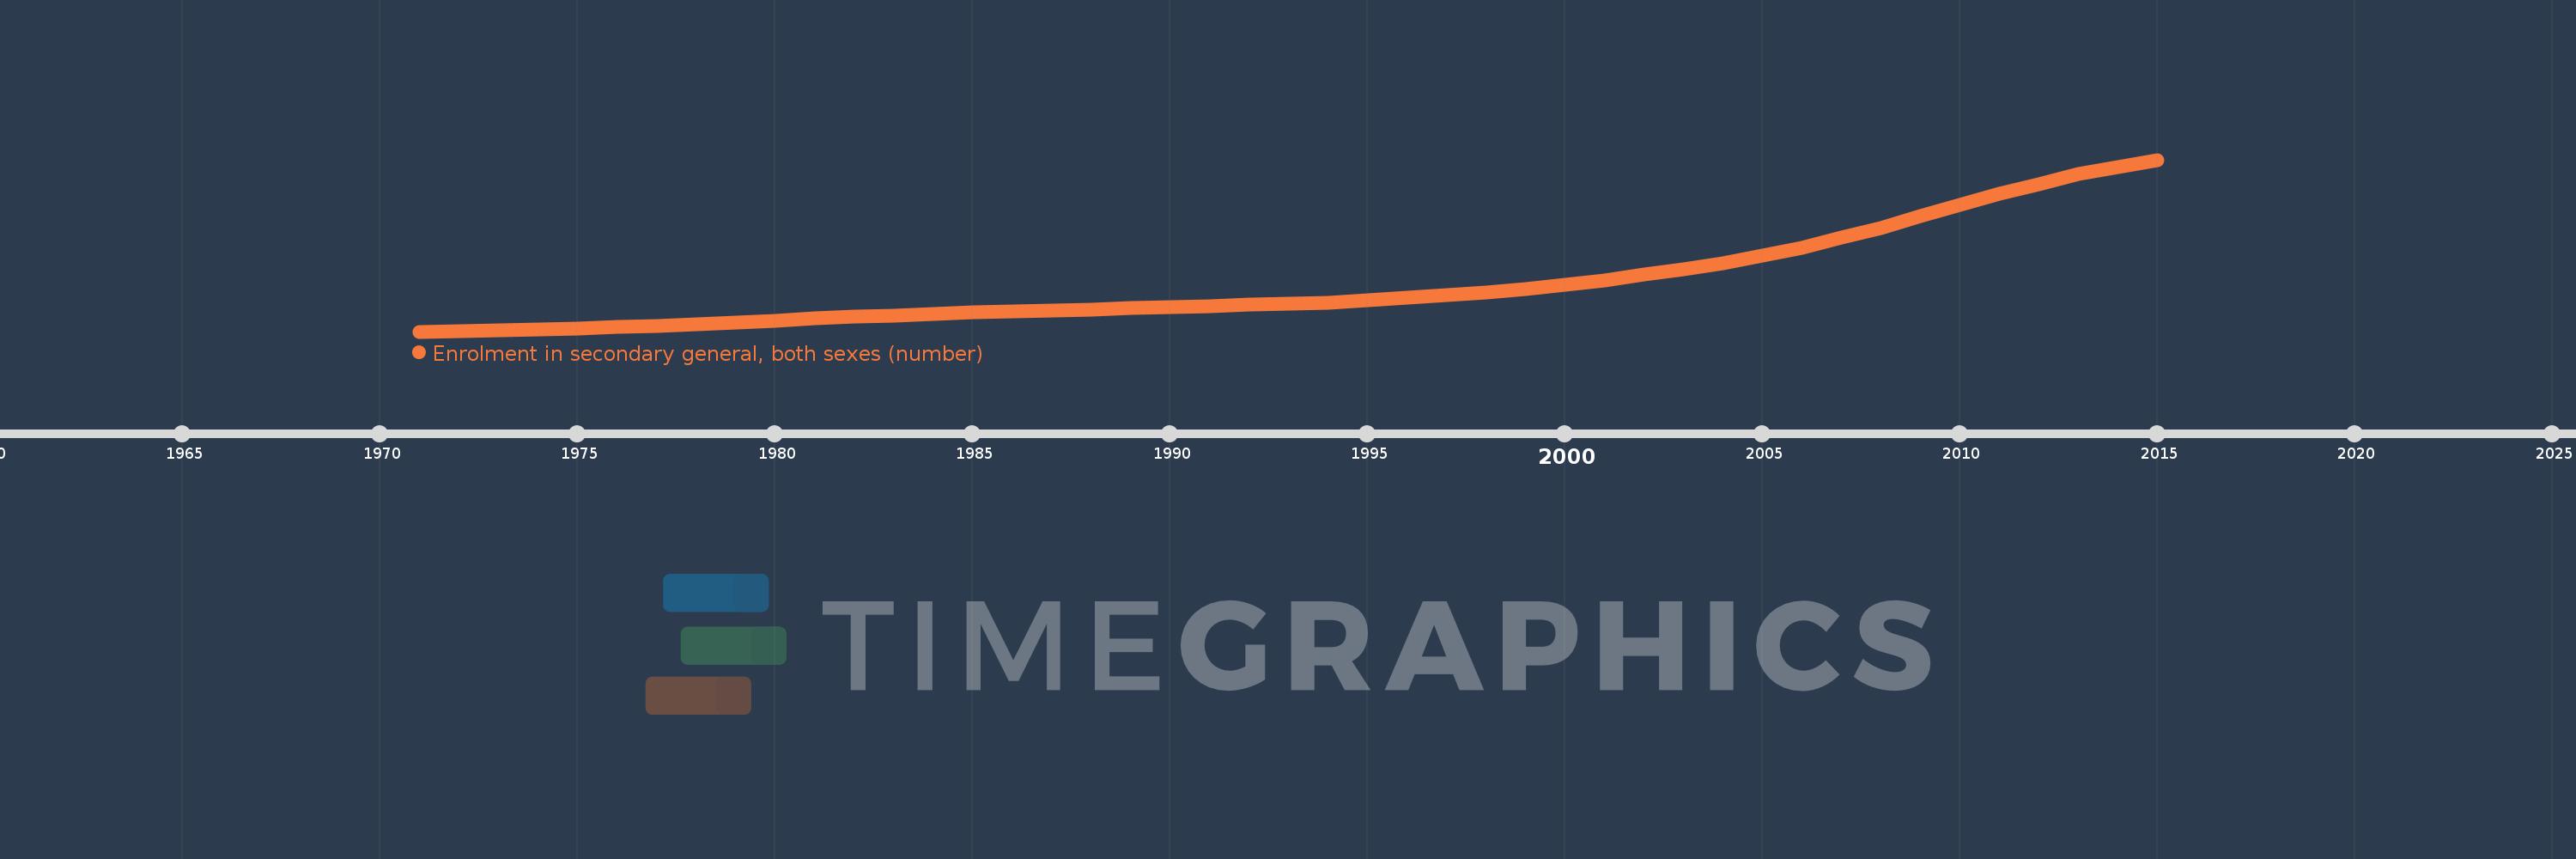
Enrolment in secondary general, both sexes (number)
2015,2014,2013,2012,2011,2010,2009,2008,2007,2006,2005,2004,2003,2002,2001,2000,1999,1998,1997,1996,1995,1994,1993,1992,1991,1990,1989,1988,1987,1986,1985,1984,1983,1982,1981,1980,1979,1978,1977,1976,1975,1974,1973,1972,1971
This statistics in other country:
AfghanistanAlbaniaAlgeriaAmerican SamoaAndorraAngolaAntigua and BarbudaArab WorldArgentinaArmeniaArubaAustraliaAustriaAzerbaijanBahamas, TheBahrainBangladeshBarbadosBelarusBelgiumBelizeBeninBermudaBhutanBoliviaBosnia and HerzegovinaBotswanaBrazilBritish Virgin IslandsBrunei DarussalamBulgariaBurkina FasoBurundiCabo VerdeCambodiaCameroonCanadaCaribbean small statesCayman IslandsCentral African RepublicCentral Europe and the BalticsChadChileChinaColombiaComorosCongo, Dem. Rep.Congo, Rep.Costa RicaCote d'IvoireCroatiaCubaCuracaoCyprusCzech RepublicDenmarkDjiboutiDominicaDominican RepublicEarly-demographic dividendEast Asia & PacificEast Asia & Pacific (excluding high income)East Asia & Pacific (IDA & IBRD countries)EcuadorEgypt, Arab Rep.El SalvadorEquatorial GuineaEritreaEstoniaEthiopiaEuro areaEurope & Central AsiaEurope & Central Asia (excluding high income)Europe & Central Asia (IDA & IBRD countries)European UnionFaroe IslandsFijiFinlandFragile and conflict affected situationsFranceFrench PolynesiaGabonGambia, TheGeorgiaGermanyGhanaGibraltarGreeceGrenadaGuamGuatemalaGuineaGuinea-BissauGuyanaHaitiHeavily indebted poor countries (HIPC)High incomeHondurasHong Kong SAR, ChinaHungaryIBRD onlyIcelandIDA & IBRD totalIDA blendIDA onlyIDA totalIndiaIndonesiaIran, Islamic Rep.IraqIrelandIsraelItalyJamaicaJapanJordanKazakhstanKenyaKiribatiKorea, Dem. People’s Rep.Korea, Rep.KuwaitKyrgyz RepublicLao PDRLate-demographic dividendLatin America & Caribbean Latin America & Caribbean (excluding high income)Latin America & the Caribbean (IDA & IBRD countries)LatviaLeast developed countries: UN classificationLebanonLesothoLiberiaLibyaLiechtensteinLithuaniaLow & middle incomeLow incomeLower middle incomeLuxembourgMacao SAR, ChinaMacedonia, FYRMadagascarMalawiMalaysiaMaldivesMaliMaltaMarshall IslandsMauritaniaMauritiusMexicoMicronesia, Fed. Sts.Middle East & North AfricaMiddle East & North Africa (excluding high income)Middle East & North Africa (IDA & IBRD countries)Middle incomeMoldovaMonacoMongoliaMontenegroMoroccoMozambiqueMyanmarNamibiaNauruNepalNetherlandsNew CaledoniaNew ZealandNicaraguaNigerNigeriaNorth AmericaNorwayOECD membersOmanOther small statesPacific island small statesPakistanPalauPanamaPapua New GuineaParaguayPeruPhilippinesPolandPortugalPost-demographic dividendPre-demographic dividendPuerto RicoQatarRomaniaRussian FederationRwandaSamoaSan MarinoSao Tome and PrincipeSaudi ArabiaSenegalSerbiaSeychellesSierra LeoneSingaporeSint Maarten (Dutch part)Slovak RepublicSloveniaSmall statesSolomon IslandsSomaliaSouth AfricaSouth AsiaSouth Asia (IDA & IBRD)South SudanSpainSri LankaSt. Kitts and NevisSt. LuciaSt. Vincent and the GrenadinesSub-Saharan Africa Sub-Saharan Africa (excluding high income)Sub-Saharan Africa (IDA & IBRD countries)SudanSurinameSwazilandSwedenSwitzerlandSyrian Arab RepublicTajikistanTanzaniaThailandTimor-LesteTogoTongaTrinidad and TobagoTunisiaTurkeyTurkmenistanTurks and Caicos IslandsTuvaluUgandaUkraineUnited Arab EmiratesUnited KingdomUnited StatesUpper middle incomeUruguayUzbekistanVanuatuVenezuela, RBVietnamVirgin Islands (U.S.)West Bank and GazaWorldYemen, Rep.ZambiaZimbabwe Timeline:
This timeline shows a graph from 1971 to 2015 of Heavily indebted poor countries (HIPC). No data until 1970. Number of actual observations by date: 45.
Source name:
World Development Indicators
Source organization:
UNESCO Institute for Statistics
Categories, topics:
Education
Last updated:
apr 23, 2017
Indicators value changes by year
Minimum:
3.059 mln
jan 1, 1971
Maximum:
35.984 mln
jan 1, 2015
At the date of observation
Value
Absolute change
Change from previous value
jan 1, 1971
3.059 mln
+3.059 mln
0.0%
jan 1, 1972
3.157 mln
+97.754K
3.2%
jan 1, 1973
3.331 mln
+174.787K
5.54%
jan 1, 1974
3.502 mln
+170.496K
5.12%
jan 1, 1975
3.638 mln
+135.64K
3.87%
jan 1, 1976
3.893 mln
+255.354K
7.02%
jan 1, 1977
4.162 mln
+269.214K
6.92%
jan 1, 1978
4.468 mln
+306.279K
7.36%
jan 1, 1979
4.786 mln
+317.555K
7.11%
jan 1, 1980
5.148 mln
+362.297K
7.57%
jan 1, 1981
5.553 mln
+404.933K
7.87%
jan 1, 1982
5.979 mln
+425.874K
7.67%
jan 1, 1983
6.155 mln
+175.431K
2.93%
jan 1, 1984
6.46 mln
+305.402K
4.96%
jan 1, 1985
6.776 mln
+315.865K
4.89%
jan 1, 1986
6.881 mln
+105.636K
1.56%
jan 1, 1987
7.026 mln
+144.621K
2.1%
jan 1, 1988
7.198 mln
+172.211K
2.45%
jan 1, 1989
7.545 mln
+346.786K
4.82%
jan 1, 1990
7.675 mln
+129.93K
1.72%
jan 1, 1991
7.875 mln
+200.352K
2.61%
jan 1, 1992
8.236 mln
+360.59K
4.58%
jan 1, 1993
8.384 mln
+147.726K
1.79%
jan 1, 1994
8.602 mln
+218.466K
2.61%
jan 1, 1995
9.074 mln
+472.006K
5.49%
jan 1, 1996
9.626 mln
+551.543K
6.08%
jan 1, 1997
10.042 mln
+416.515K
4.33%
jan 1, 1998
10.53 mln
+487.944K
4.86%
jan 1, 1999
11.169 mln
+639.315K
6.07%
jan 1, 2000
11.996 mln
+826.572K
7.4%
jan 1, 2001
12.818 mln
+822.33K
6.86%
jan 1, 2002
13.932 mln
+1.114 mln
8.69%
jan 1, 2003
15.076 mln
+1.144 mln
8.21%
jan 1, 2004
16.146 mln
+1.07 mln
7.1%
jan 1, 2005
17.655 mln
+1.509 mln
9.35%
jan 1, 2006
19.167 mln
+1.512 mln
8.56%
jan 1, 2007
21.063 mln
+1.896 mln
9.89%
jan 1, 2008
22.916 mln
+1.853 mln
8.8%
jan 1, 2009
25.186 mln
+2.27 mln
9.91%
jan 1, 2010
27.288 mln
+2.101 mln
8.34%
jan 1, 2011
29.484 mln
+2.197 mln
8.05%
jan 1, 2012
31.313 mln
+1.829 mln
6.2%
jan 1, 2013
33.191 mln
+1.878 mln
6.0%
jan 1, 2014
34.642 mln
+1.451 mln
4.37%
jan 1, 2015
35.984 mln
+1.342 mln
3.87%
Ranking of countries by current statistics by years


Comments: