29
/
en
AIzaSyAYiBZKx7MnpbEhh9jyipgxe19OcubqV5w
April 1, 2024
192946
Mauritania
MRT
true
2
1
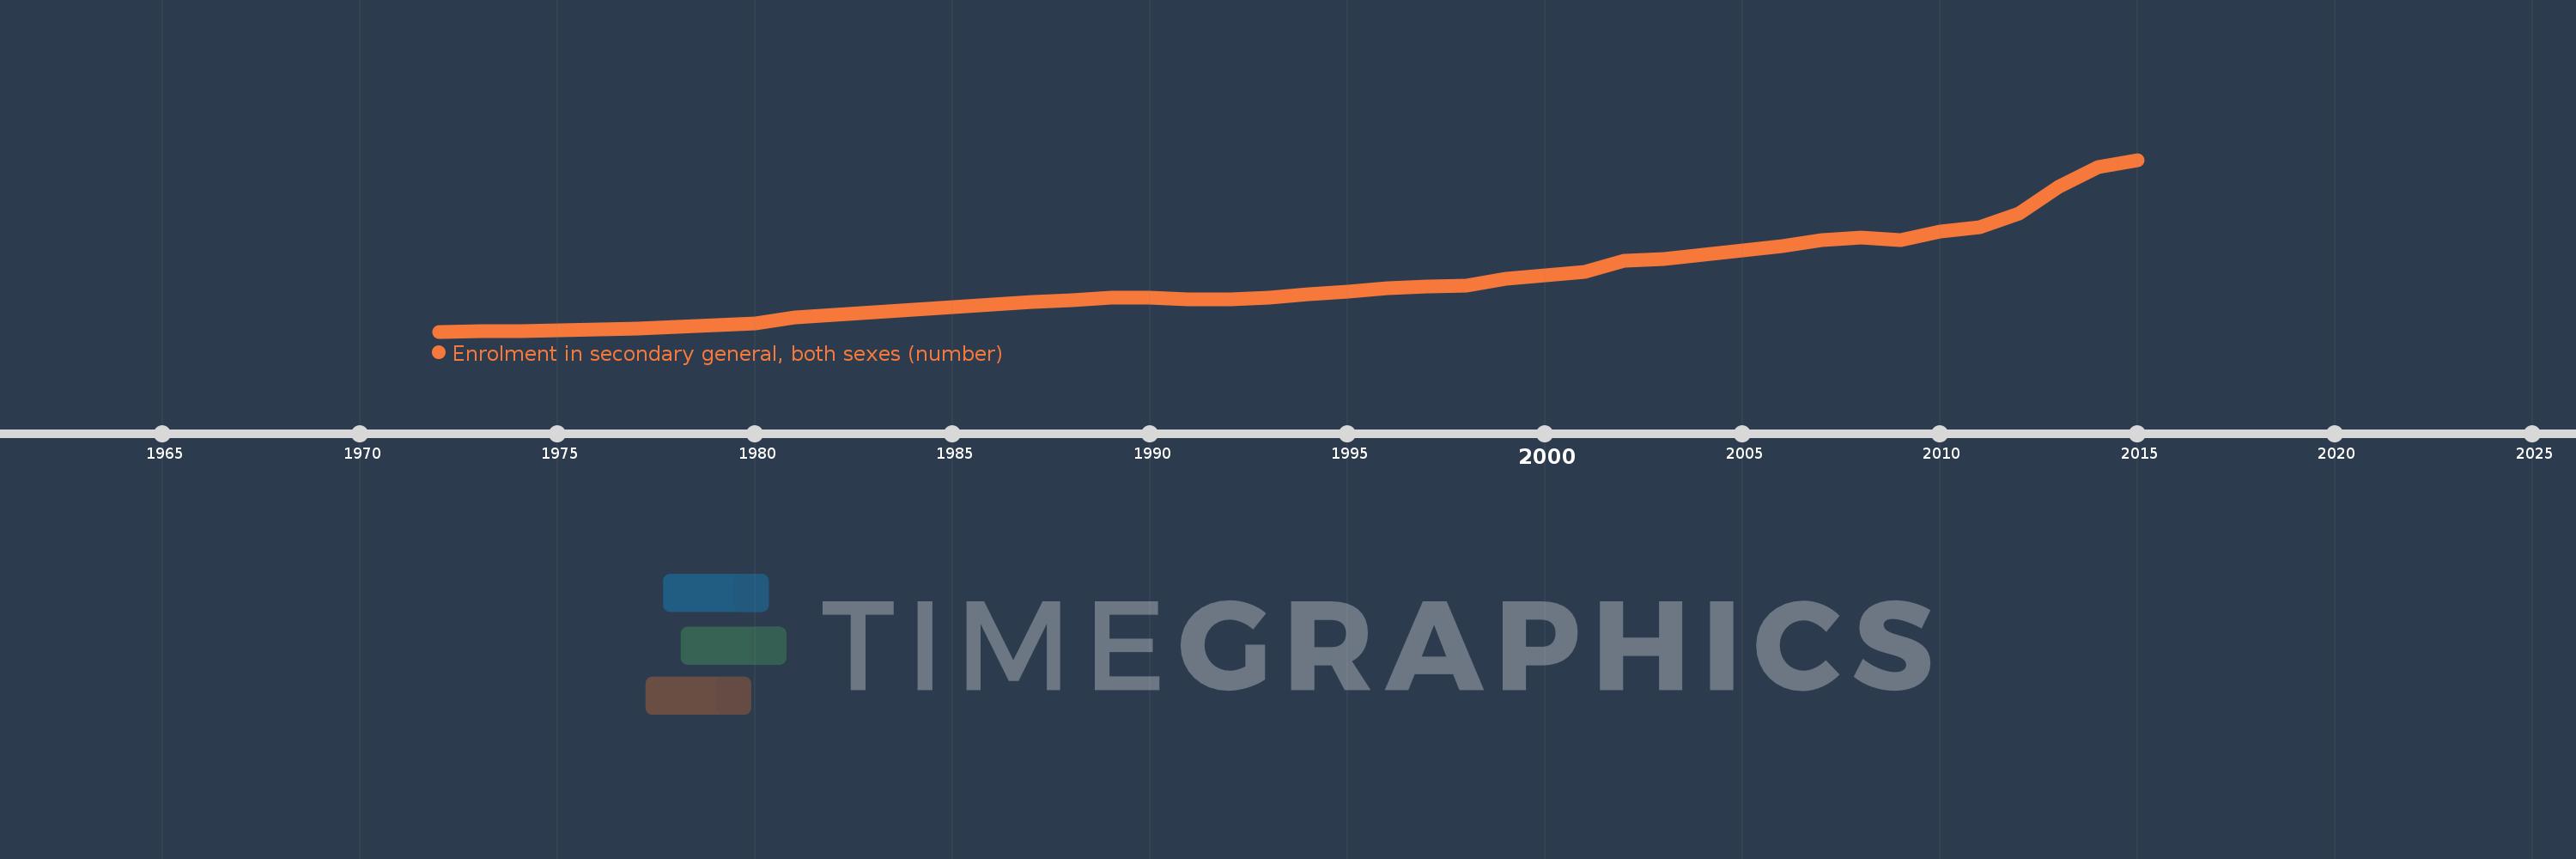
Enrolment in secondary general, both sexes (number)
2015,2014,2013,2012,2011,2010,2009,2008,2007,2006,2005,2004,2003,2002,2001,2000,1999,1998,1997,1996,1995,1994,1993,1992,1991,1990,1989,1988,1987,1986,1985,1984,1983,1982,1981,1980,1979,1978,1977,1976,1975,1974,1973,1972
This statistics in other country:
AfghanistanAlbaniaAlgeriaAmerican SamoaAndorraAngolaAntigua and BarbudaArab WorldArgentinaArmeniaArubaAustraliaAustriaAzerbaijanBahamas, TheBahrainBangladeshBarbadosBelarusBelgiumBelizeBeninBermudaBhutanBoliviaBosnia and HerzegovinaBotswanaBrazilBritish Virgin IslandsBrunei DarussalamBulgariaBurkina FasoBurundiCabo VerdeCambodiaCameroonCanadaCaribbean small statesCayman IslandsCentral African RepublicCentral Europe and the BalticsChadChileChinaColombiaComorosCongo, Dem. Rep.Congo, Rep.Costa RicaCote d'IvoireCroatiaCubaCuracaoCyprusCzech RepublicDenmarkDjiboutiDominicaDominican RepublicEarly-demographic dividendEast Asia & PacificEast Asia & Pacific (excluding high income)East Asia & Pacific (IDA & IBRD countries)EcuadorEgypt, Arab Rep.El SalvadorEquatorial GuineaEritreaEstoniaEthiopiaEuro areaEurope & Central AsiaEurope & Central Asia (excluding high income)Europe & Central Asia (IDA & IBRD countries)European UnionFaroe IslandsFijiFinlandFragile and conflict affected situationsFranceFrench PolynesiaGabonGambia, TheGeorgiaGermanyGhanaGibraltarGreeceGrenadaGuamGuatemalaGuineaGuinea-BissauGuyanaHaitiHeavily indebted poor countries (HIPC)High incomeHondurasHong Kong SAR, ChinaHungaryIBRD onlyIcelandIDA & IBRD totalIDA blendIDA onlyIDA totalIndiaIndonesiaIran, Islamic Rep.IraqIrelandIsraelItalyJamaicaJapanJordanKazakhstanKenyaKiribatiKorea, Dem. People’s Rep.Korea, Rep.KuwaitKyrgyz RepublicLao PDRLate-demographic dividendLatin America & Caribbean Latin America & Caribbean (excluding high income)Latin America & the Caribbean (IDA & IBRD countries)LatviaLeast developed countries: UN classificationLebanonLesothoLiberiaLibyaLiechtensteinLithuaniaLow & middle incomeLow incomeLower middle incomeLuxembourgMacao SAR, ChinaMacedonia, FYRMadagascarMalawiMalaysiaMaldivesMaliMaltaMarshall IslandsMauritaniaMauritiusMexicoMicronesia, Fed. Sts.Middle East & North AfricaMiddle East & North Africa (excluding high income)Middle East & North Africa (IDA & IBRD countries)Middle incomeMoldovaMonacoMongoliaMontenegroMoroccoMozambiqueMyanmarNamibiaNauruNepalNetherlandsNew CaledoniaNew ZealandNicaraguaNigerNigeriaNorth AmericaNorwayOECD membersOmanOther small statesPacific island small statesPakistanPalauPanamaPapua New GuineaParaguayPeruPhilippinesPolandPortugalPost-demographic dividendPre-demographic dividendPuerto RicoQatarRomaniaRussian FederationRwandaSamoaSan MarinoSao Tome and PrincipeSaudi ArabiaSenegalSerbiaSeychellesSierra LeoneSingaporeSint Maarten (Dutch part)Slovak RepublicSloveniaSmall statesSolomon IslandsSomaliaSouth AfricaSouth AsiaSouth Asia (IDA & IBRD)South SudanSpainSri LankaSt. Kitts and NevisSt. LuciaSt. Vincent and the GrenadinesSub-Saharan Africa Sub-Saharan Africa (excluding high income)Sub-Saharan Africa (IDA & IBRD countries)SudanSurinameSwazilandSwedenSwitzerlandSyrian Arab RepublicTajikistanTanzaniaThailandTimor-LesteTogoTongaTrinidad and TobagoTunisiaTurkeyTurkmenistanTurks and Caicos IslandsTuvaluUgandaUkraineUnited Arab EmiratesUnited KingdomUnited StatesUpper middle incomeUruguayUzbekistanVanuatuVenezuela, RBVietnamVirgin Islands (U.S.)West Bank and GazaWorldYemen, Rep.ZambiaZimbabwe Timeline:
This timeline shows a graph from 1972 to 2015 of Mauritania. No data until 1971. Number of actual observations by date: 44.
Source name:
World Development Indicators
Source organization:
UNESCO Institute for Statistics
Categories, topics:
Education
Last updated:
apr 23, 2017
Indicators value changes by year
Minimum:
3.408K
jan 1, 1972
Maximum:
176.915K
jan 1, 2015
At the date of observation
Value
Absolute change
Change from previous value
jan 1, 1972
3.408K
+3.408K
0.0%
jan 1, 1973
3.745K
+337.0
9.89%
jan 1, 1974
4.072K
+327.0
8.73%
jan 1, 1975
4.716K
+644.0
15.82%
jan 1, 1976
5.493K
+777.0
16.48%
jan 1, 1977
6.571K
+1.078K
19.62%
jan 1, 1978
7.995K
+1.424K
21.67%
jan 1, 1979
9.66K
+1.665K
20.83%
jan 1, 1980
11.957K
+2.297K
23.78%
jan 1, 1981
17.427K
+5.47K
45.75%
jan 1, 1982
20.248K
+2.821K
16.19%
jan 1, 1983
22.834K
+2.586K
12.77%
jan 1, 1984
25.7K
+2.866K
12.55%
jan 1, 1985
27.924K
+2.224K
8.65%
jan 1, 1986
30.84K
+2.916K
10.44%
jan 1, 1987
33.148K
+2.308K
7.48%
jan 1, 1988
35.129K
+1.981K
5.98%
jan 1, 1989
37.412K
+2.283K
6.5%
jan 1, 1990
37.37K
-42.0
-0.11%
jan 1, 1991
35.758K
-1.612K
-4.31%
jan 1, 1992
36.177K
+419.0
1.17%
jan 1, 1993
38.039K
+1.862K
5.15%
jan 1, 1994
41.071K
+3.032K
7.97%
jan 1, 1995
43.861K
+2.79K
6.79%
jan 1, 1996
46.917K
+3.056K
6.97%
jan 1, 1997
49.221K
+2.304K
4.91%
jan 1, 1998
50.095K
+874.0
1.78%
jan 1, 1999
56.5K
+6.405K
12.79%
jan 1, 2000
60.029K
+3.529K
6.25%
jan 1, 2001
63.735K
+3.706K
6.17%
jan 1, 2002
74.742K
+11.007K
17.27%
jan 1, 2003
76.837K
+2.095K
2.8%
jan 1, 2004
81.278K
+4.441K
5.78%
jan 1, 2005
85.588K
+4.31K
5.3%
jan 1, 2006
89.54K
+3.952K
4.62%
jan 1, 2007
95.772K
+6.232K
6.96%
jan 1, 2008
98.73K
+2.958K
3.09%
jan 1, 2009
95.497K
-3.233K
-3.27%
jan 1, 2010
104.554K
+9.057K
9.48%
jan 1, 2011
108.499K
+3.945K
3.77%
jan 1, 2012
122.595K
+14.096K
12.99%
jan 1, 2013
149.633K
+27.038K
22.05%
jan 1, 2014
169.126K
+19.493K
13.03%
jan 1, 2015
176.915K
+7.789K
4.61%
Ranking of countries by current statistics by years


Comments: