29
/
en
AIzaSyAYiBZKx7MnpbEhh9jyipgxe19OcubqV5w
April 1, 2024
36518
IBRD only
IBD
false
2
1
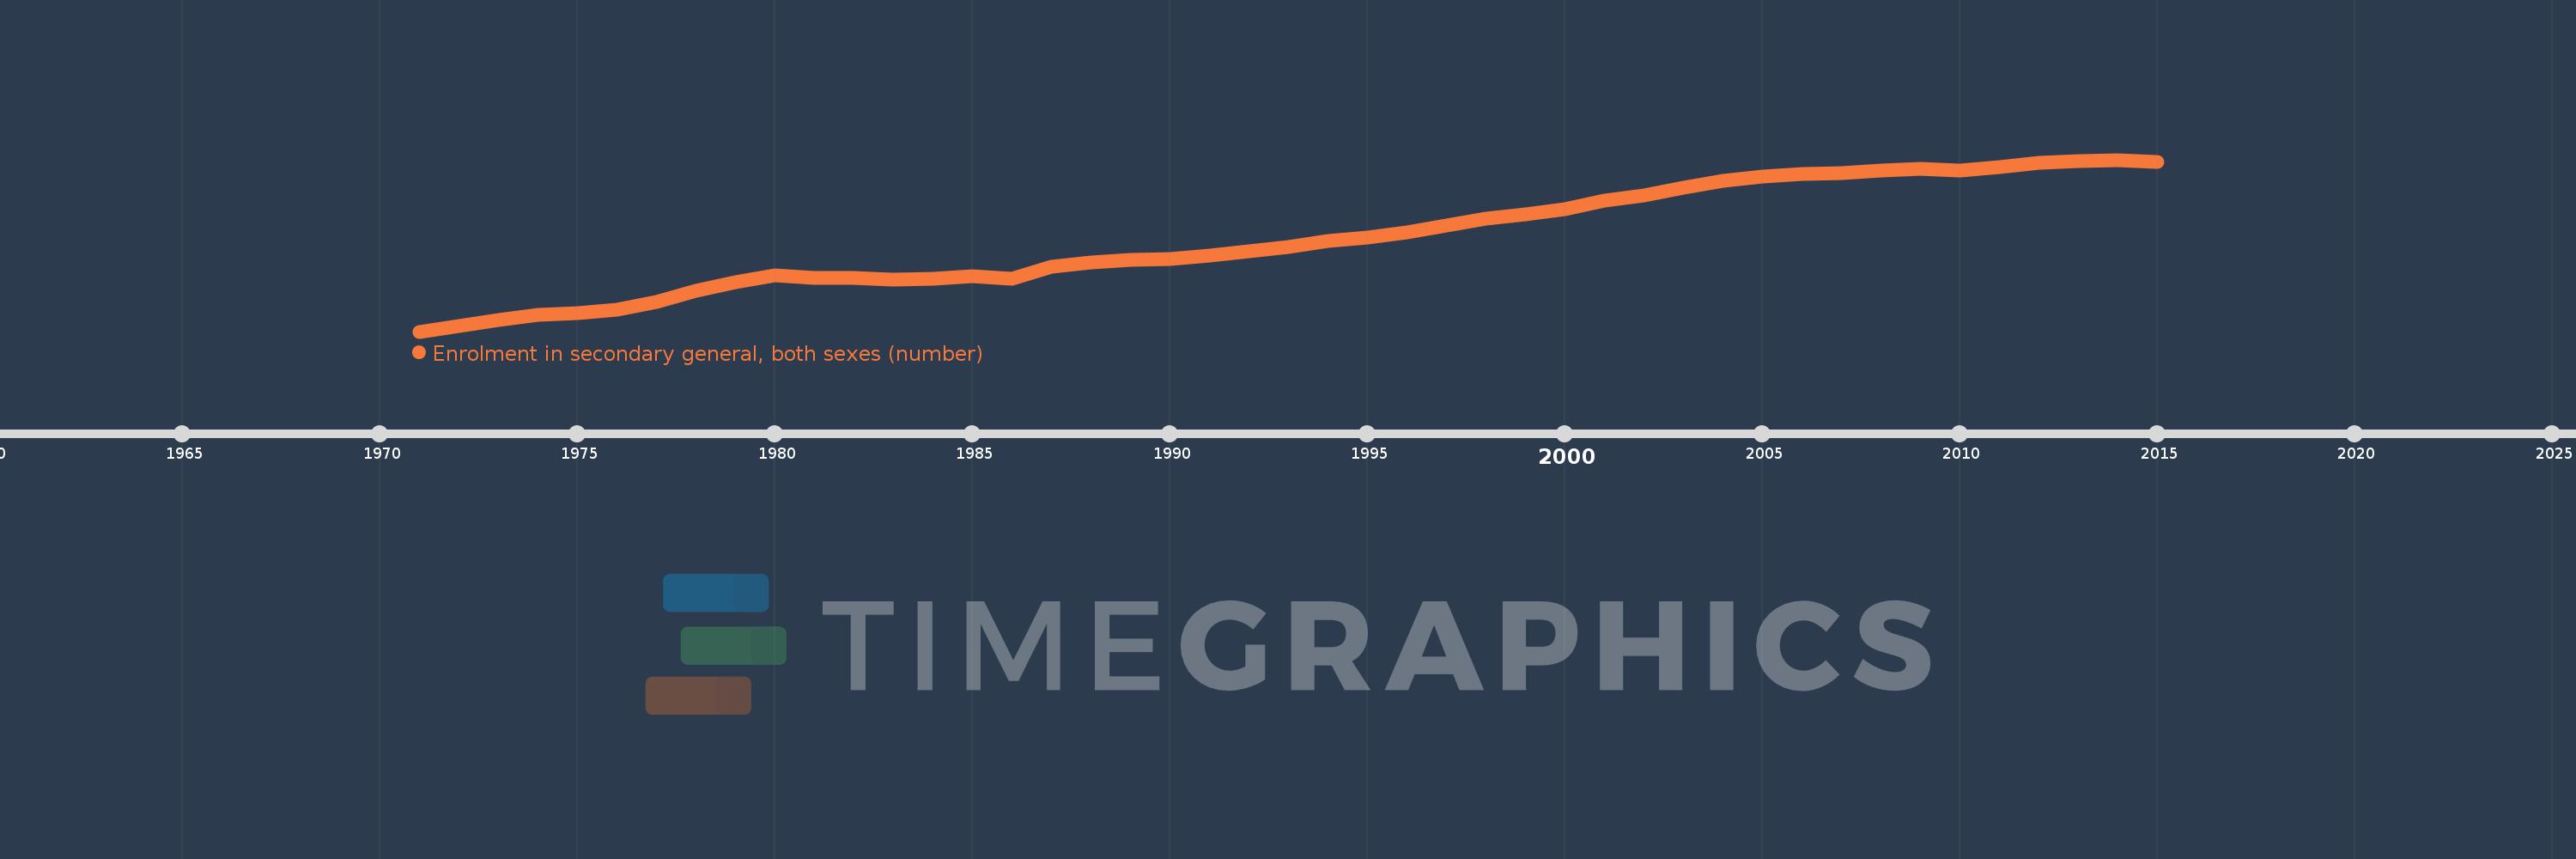
Enrolment in secondary general, both sexes (number)
2015,2014,2013,2012,2011,2010,2009,2008,2007,2006,2005,2004,2003,2002,2001,2000,1999,1998,1997,1996,1995,1994,1993,1992,1991,1990,1989,1988,1987,1986,1985,1984,1983,1982,1981,1980,1979,1978,1977,1976,1975,1974,1973,1972,1971
This statistics in other country:
AfghanistanAlbaniaAlgeriaAmerican SamoaAndorraAngolaAntigua and BarbudaArab WorldArgentinaArmeniaArubaAustraliaAustriaAzerbaijanBahamas, TheBahrainBangladeshBarbadosBelarusBelgiumBelizeBeninBermudaBhutanBoliviaBosnia and HerzegovinaBotswanaBrazilBritish Virgin IslandsBrunei DarussalamBulgariaBurkina FasoBurundiCabo VerdeCambodiaCameroonCanadaCaribbean small statesCayman IslandsCentral African RepublicCentral Europe and the BalticsChadChileChinaColombiaComorosCongo, Dem. Rep.Congo, Rep.Costa RicaCote d'IvoireCroatiaCubaCuracaoCyprusCzech RepublicDenmarkDjiboutiDominicaDominican RepublicEarly-demographic dividendEast Asia & PacificEast Asia & Pacific (excluding high income)East Asia & Pacific (IDA & IBRD countries)EcuadorEgypt, Arab Rep.El SalvadorEquatorial GuineaEritreaEstoniaEthiopiaEuro areaEurope & Central AsiaEurope & Central Asia (excluding high income)Europe & Central Asia (IDA & IBRD countries)European UnionFaroe IslandsFijiFinlandFragile and conflict affected situationsFranceFrench PolynesiaGabonGambia, TheGeorgiaGermanyGhanaGibraltarGreeceGrenadaGuamGuatemalaGuineaGuinea-BissauGuyanaHaitiHeavily indebted poor countries (HIPC)High incomeHondurasHong Kong SAR, ChinaHungaryIBRD onlyIcelandIDA & IBRD totalIDA blendIDA onlyIDA totalIndiaIndonesiaIran, Islamic Rep.IraqIrelandIsraelItalyJamaicaJapanJordanKazakhstanKenyaKiribatiKorea, Dem. People’s Rep.Korea, Rep.KuwaitKyrgyz RepublicLao PDRLate-demographic dividendLatin America & Caribbean Latin America & Caribbean (excluding high income)Latin America & the Caribbean (IDA & IBRD countries)LatviaLeast developed countries: UN classificationLebanonLesothoLiberiaLibyaLiechtensteinLithuaniaLow & middle incomeLow incomeLower middle incomeLuxembourgMacao SAR, ChinaMacedonia, FYRMadagascarMalawiMalaysiaMaldivesMaliMaltaMarshall IslandsMauritaniaMauritiusMexicoMicronesia, Fed. Sts.Middle East & North AfricaMiddle East & North Africa (excluding high income)Middle East & North Africa (IDA & IBRD countries)Middle incomeMoldovaMonacoMongoliaMontenegroMoroccoMozambiqueMyanmarNamibiaNauruNepalNetherlandsNew CaledoniaNew ZealandNicaraguaNigerNigeriaNorth AmericaNorwayOECD membersOmanOther small statesPacific island small statesPakistanPalauPanamaPapua New GuineaParaguayPeruPhilippinesPolandPortugalPost-demographic dividendPre-demographic dividendPuerto RicoQatarRomaniaRussian FederationRwandaSamoaSan MarinoSao Tome and PrincipeSaudi ArabiaSenegalSerbiaSeychellesSierra LeoneSingaporeSint Maarten (Dutch part)Slovak RepublicSloveniaSmall statesSolomon IslandsSomaliaSouth AfricaSouth AsiaSouth Asia (IDA & IBRD)South SudanSpainSri LankaSt. Kitts and NevisSt. LuciaSt. Vincent and the GrenadinesSub-Saharan Africa Sub-Saharan Africa (excluding high income)Sub-Saharan Africa (IDA & IBRD countries)SudanSurinameSwazilandSwedenSwitzerlandSyrian Arab RepublicTajikistanTanzaniaThailandTimor-LesteTogoTongaTrinidad and TobagoTunisiaTurkeyTurkmenistanTurks and Caicos IslandsTuvaluUgandaUkraineUnited Arab EmiratesUnited KingdomUnited StatesUpper middle incomeUruguayUzbekistanVanuatuVenezuela, RBVietnamVirgin Islands (U.S.)West Bank and GazaWorldYemen, Rep.ZambiaZimbabwe Timeline:
This timeline shows a graph from 1971 to 2015 of IBRD only. No data until 1970. Number of actual observations by date: 45.
Source name:
World Development Indicators
Source organization:
UNESCO Institute for Statistics
Categories, topics:
Education
Last updated:
apr 23, 2017
Indicators value changes by year
Minimum:
89.155 mln
jan 1, 1971
Maximum:
334.944 mln
jan 1, 2014
At the date of observation
Value
Absolute change
Change from previous value
jan 1, 1971
89.155 mln
+89.155 mln
0.0%
jan 1, 1972
97.727 mln
+8.571 mln
9.61%
jan 1, 1973
106.067 mln
+8.34 mln
8.53%
jan 1, 1974
113.409 mln
+7.342 mln
6.92%
jan 1, 1975
116.011 mln
+2.602 mln
2.29%
jan 1, 1976
120.97 mln
+4.959 mln
4.27%
jan 1, 1977
131.602 mln
+10.632 mln
8.79%
jan 1, 1978
147.875 mln
+16.273 mln
12.37%
jan 1, 1979
159.826 mln
+11.951 mln
8.08%
jan 1, 1980
169.996 mln
+10.171 mln
6.36%
jan 1, 1981
166.496 mln
-3.5 mln
-2.06%
jan 1, 1982
166.097 mln
-399.056K
-0.24%
jan 1, 1983
163.226 mln
-2.872 mln
-1.73%
jan 1, 1984
165.178 mln
+1.953 mln
1.2%
jan 1, 1985
168.205 mln
+3.026 mln
1.83%
jan 1, 1986
164.789 mln
-3.415 mln
-2.03%
jan 1, 1987
181.835 mln
+17.046 mln
10.34%
jan 1, 1988
187.663 mln
+5.828 mln
3.2%
jan 1, 1989
191.748 mln
+4.086 mln
2.18%
jan 1, 1990
193.409 mln
+1.66 mln
0.87%
jan 1, 1991
197.514 mln
+4.105 mln
2.12%
jan 1, 1992
203.53 mln
+6.016 mln
3.05%
jan 1, 1993
210.621 mln
+7.091 mln
3.48%
jan 1, 1994
218.291 mln
+7.67 mln
3.64%
jan 1, 1995
223.817 mln
+5.526 mln
2.53%
jan 1, 1996
231.397 mln
+7.58 mln
3.39%
jan 1, 1997
240.722 mln
+9.325 mln
4.03%
jan 1, 1998
250.909 mln
+10.187 mln
4.23%
jan 1, 1999
257.476 mln
+6.566 mln
2.62%
jan 1, 2000
264.015 mln
+6.539 mln
2.54%
jan 1, 2001
276.124 mln
+12.109 mln
4.59%
jan 1, 2002
283.975 mln
+7.851 mln
2.84%
jan 1, 2003
294.986 mln
+11.011 mln
3.88%
jan 1, 2004
304.954 mln
+9.968 mln
3.38%
jan 1, 2005
310.652 mln
+5.698 mln
1.87%
jan 1, 2006
314.702 mln
+4.049 mln
1.3%
jan 1, 2007
315.54 mln
+838.368K
0.27%
jan 1, 2008
319.206 mln
+3.666 mln
1.16%
jan 1, 2009
321.49 mln
+2.285 mln
0.72%
jan 1, 2010
320.062 mln
-1.429 mln
-0.44%
jan 1, 2011
324.851 mln
+4.789 mln
1.5%
jan 1, 2012
330.088 mln
+5.237 mln
1.61%
jan 1, 2013
333.062 mln
+2.974 mln
0.9%
jan 1, 2014
334.944 mln
+1.882 mln
0.57%
jan 1, 2015
331.452 mln
-3.492 mln
-1.04%
Ranking of countries by current statistics by years


Comments: