29
/
en
AIzaSyAYiBZKx7MnpbEhh9jyipgxe19OcubqV5w
April 1, 2024
110851
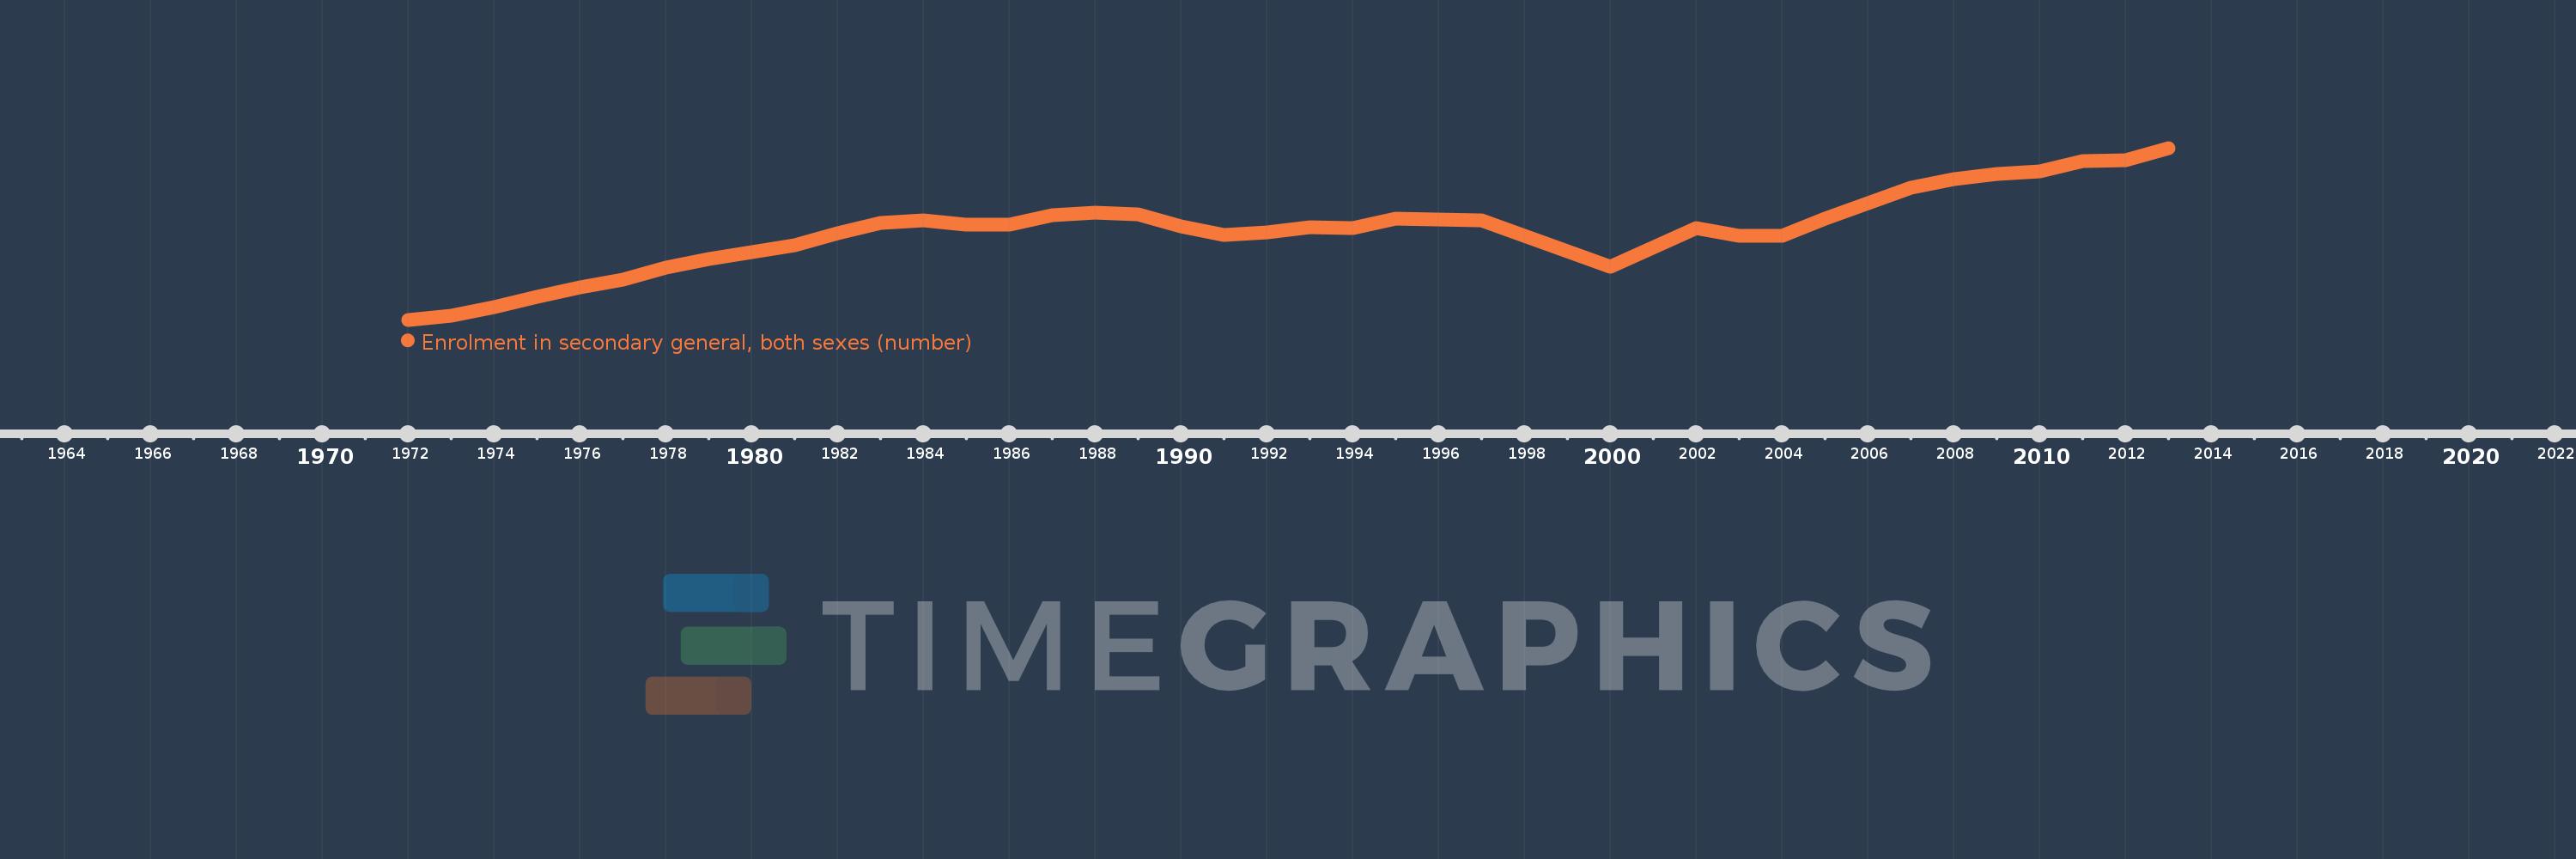
Congo, Rep.
COG
true
2
1
Enrolment in secondary general, both sexes (number)
2013,2012,2011,2010,2009,2008,2007,2006,2005,2004,2003,2002,2000,1997,1995,1994,1993,1992,1991,1990,1989,1988,1987,1986,1985,1984,1983,1982,1981,1980,1979,1978,1977,1976,1975,1974,1973,1972
This statistics in other country:
AfghanistanAlbaniaAlgeriaAmerican SamoaAndorraAngolaAntigua and BarbudaArab WorldArgentinaArmeniaArubaAustraliaAustriaAzerbaijanBahamas, TheBahrainBangladeshBarbadosBelarusBelgiumBelizeBeninBermudaBhutanBoliviaBosnia and HerzegovinaBotswanaBrazilBritish Virgin IslandsBrunei DarussalamBulgariaBurkina FasoBurundiCabo VerdeCambodiaCameroonCanadaCaribbean small statesCayman IslandsCentral African RepublicCentral Europe and the BalticsChadChileChinaColombiaComorosCongo, Dem. Rep.Congo, Rep.Costa RicaCote d'IvoireCroatiaCubaCuracaoCyprusCzech RepublicDenmarkDjiboutiDominicaDominican RepublicEarly-demographic dividendEast Asia & PacificEast Asia & Pacific (excluding high income)East Asia & Pacific (IDA & IBRD countries)EcuadorEgypt, Arab Rep.El SalvadorEquatorial GuineaEritreaEstoniaEthiopiaEuro areaEurope & Central AsiaEurope & Central Asia (excluding high income)Europe & Central Asia (IDA & IBRD countries)European UnionFaroe IslandsFijiFinlandFragile and conflict affected situationsFranceFrench PolynesiaGabonGambia, TheGeorgiaGermanyGhanaGibraltarGreeceGrenadaGuamGuatemalaGuineaGuinea-BissauGuyanaHaitiHeavily indebted poor countries (HIPC)High incomeHondurasHong Kong SAR, ChinaHungaryIBRD onlyIcelandIDA & IBRD totalIDA blendIDA onlyIDA totalIndiaIndonesiaIran, Islamic Rep.IraqIrelandIsraelItalyJamaicaJapanJordanKazakhstanKenyaKiribatiKorea, Dem. People’s Rep.Korea, Rep.KuwaitKyrgyz RepublicLao PDRLate-demographic dividendLatin America & Caribbean Latin America & Caribbean (excluding high income)Latin America & the Caribbean (IDA & IBRD countries)LatviaLeast developed countries: UN classificationLebanonLesothoLiberiaLibyaLiechtensteinLithuaniaLow & middle incomeLow incomeLower middle incomeLuxembourgMacao SAR, ChinaMacedonia, FYRMadagascarMalawiMalaysiaMaldivesMaliMaltaMarshall IslandsMauritaniaMauritiusMexicoMicronesia, Fed. Sts.Middle East & North AfricaMiddle East & North Africa (excluding high income)Middle East & North Africa (IDA & IBRD countries)Middle incomeMoldovaMonacoMongoliaMontenegroMoroccoMozambiqueMyanmarNamibiaNauruNepalNetherlandsNew CaledoniaNew ZealandNicaraguaNigerNigeriaNorth AmericaNorwayOECD membersOmanOther small statesPacific island small statesPakistanPalauPanamaPapua New GuineaParaguayPeruPhilippinesPolandPortugalPost-demographic dividendPre-demographic dividendPuerto RicoQatarRomaniaRussian FederationRwandaSamoaSan MarinoSao Tome and PrincipeSaudi ArabiaSenegalSerbiaSeychellesSierra LeoneSingaporeSint Maarten (Dutch part)Slovak RepublicSloveniaSmall statesSolomon IslandsSomaliaSouth AfricaSouth AsiaSouth Asia (IDA & IBRD)South SudanSpainSri LankaSt. Kitts and NevisSt. LuciaSt. Vincent and the GrenadinesSub-Saharan Africa Sub-Saharan Africa (excluding high income)Sub-Saharan Africa (IDA & IBRD countries)SudanSurinameSwazilandSwedenSwitzerlandSyrian Arab RepublicTajikistanTanzaniaThailandTimor-LesteTogoTongaTrinidad and TobagoTunisiaTurkeyTurkmenistanTurks and Caicos IslandsTuvaluUgandaUkraineUnited Arab EmiratesUnited KingdomUnited StatesUpper middle incomeUruguayUzbekistanVanuatuVenezuela, RBVietnamVirgin Islands (U.S.)West Bank and GazaWorldYemen, Rep.ZambiaZimbabwe Timeline:
This timeline shows a graph from 1972 to 2013 of Congo, Rep.. No data until 1971. Number of actual observations by date: 38.
Source name:
World Development Indicators
Source organization:
UNESCO Institute for Statistics
Categories, topics:
Education
Last updated:
apr 23, 2017
Indicators value changes by year
Minimum:
30.371K
jan 1, 1972
Maximum:
304.914K
jan 1, 2013
At the date of observation
Value
Absolute change
Change from previous value
jan 1, 1972
30.371K
+30.371K
0.0%
jan 1, 1973
37.43K
+7.059K
23.24%
jan 1, 1974
49.994K
+12.564K
33.57%
jan 1, 1975
66.71K
+16.716K
33.44%
jan 1, 1976
81.541K
+14.831K
22.23%
jan 1, 1977
94.276K
+12.735K
15.62%
jan 1, 1978
114.341K
+20.065K
21.28%
jan 1, 1979
127.21K
+12.869K
11.25%
jan 1, 1980
138.525K
+11.315K
8.89%
jan 1, 1981
148.857K
+10.332K
7.46%
jan 1, 1982
168.718K
+19.861K
13.34%
jan 1, 1983
185.555K
+16.837K
9.98%
jan 1, 1984
189.831K
+4.276K
2.3%
jan 1, 1985
182.624K
-7.207K
-3.8%
jan 1, 1986
182.294K
-330.0
-0.18%
jan 1, 1987
197.491K
+15.197K
8.34%
jan 1, 1988
201.228K
+3.737K
1.89%
jan 1, 1989
198.982K
-2.246K
-1.12%
jan 1, 1990
179.845K
-19.137K
-9.62%
jan 1, 1991
165.998K
-13.847K
-7.7%
jan 1, 1992
170.409K
+4.411K
2.66%
jan 1, 1993
178.753K
+8.344K
4.9%
jan 1, 1994
176.303K
-2.45K
-1.37%
jan 1, 1995
192.229K
+15.926K
9.03%
jan 1, 1997
189.381K
-2.848K
-1.48%
jan 1, 2000
114.45K
-74.931K
-39.57%
jan 1, 2002
176.857K
+62.407K
54.53%
jan 1, 2003
164.503K
-12.354K
-6.99%
jan 1, 2004
164.237K
-266.0
-0.16%
jan 1, 2005
191.857K
+27.62K
16.82%
jan 1, 2006
216.621K
+24.764K
12.91%
jan 1, 2007
241.386K
+24.765K
11.43%
jan 1, 2008
255.101K
+13.715K
5.68%
jan 1, 2009
263.449K
+8.348K
3.27%
jan 1, 2010
266.852K
+3.403K
1.29%
jan 1, 2011
283.745K
+16.893K
6.33%
jan 1, 2012
285.384K
+1.639K
0.58%
jan 1, 2013
304.914K
+19.53K
6.84%
Ranking of countries by current statistics by years


Comments: