29
/
en
AIzaSyAYiBZKx7MnpbEhh9jyipgxe19OcubqV5w
April 1, 2024
52373
OECD members
OED
false
2
1
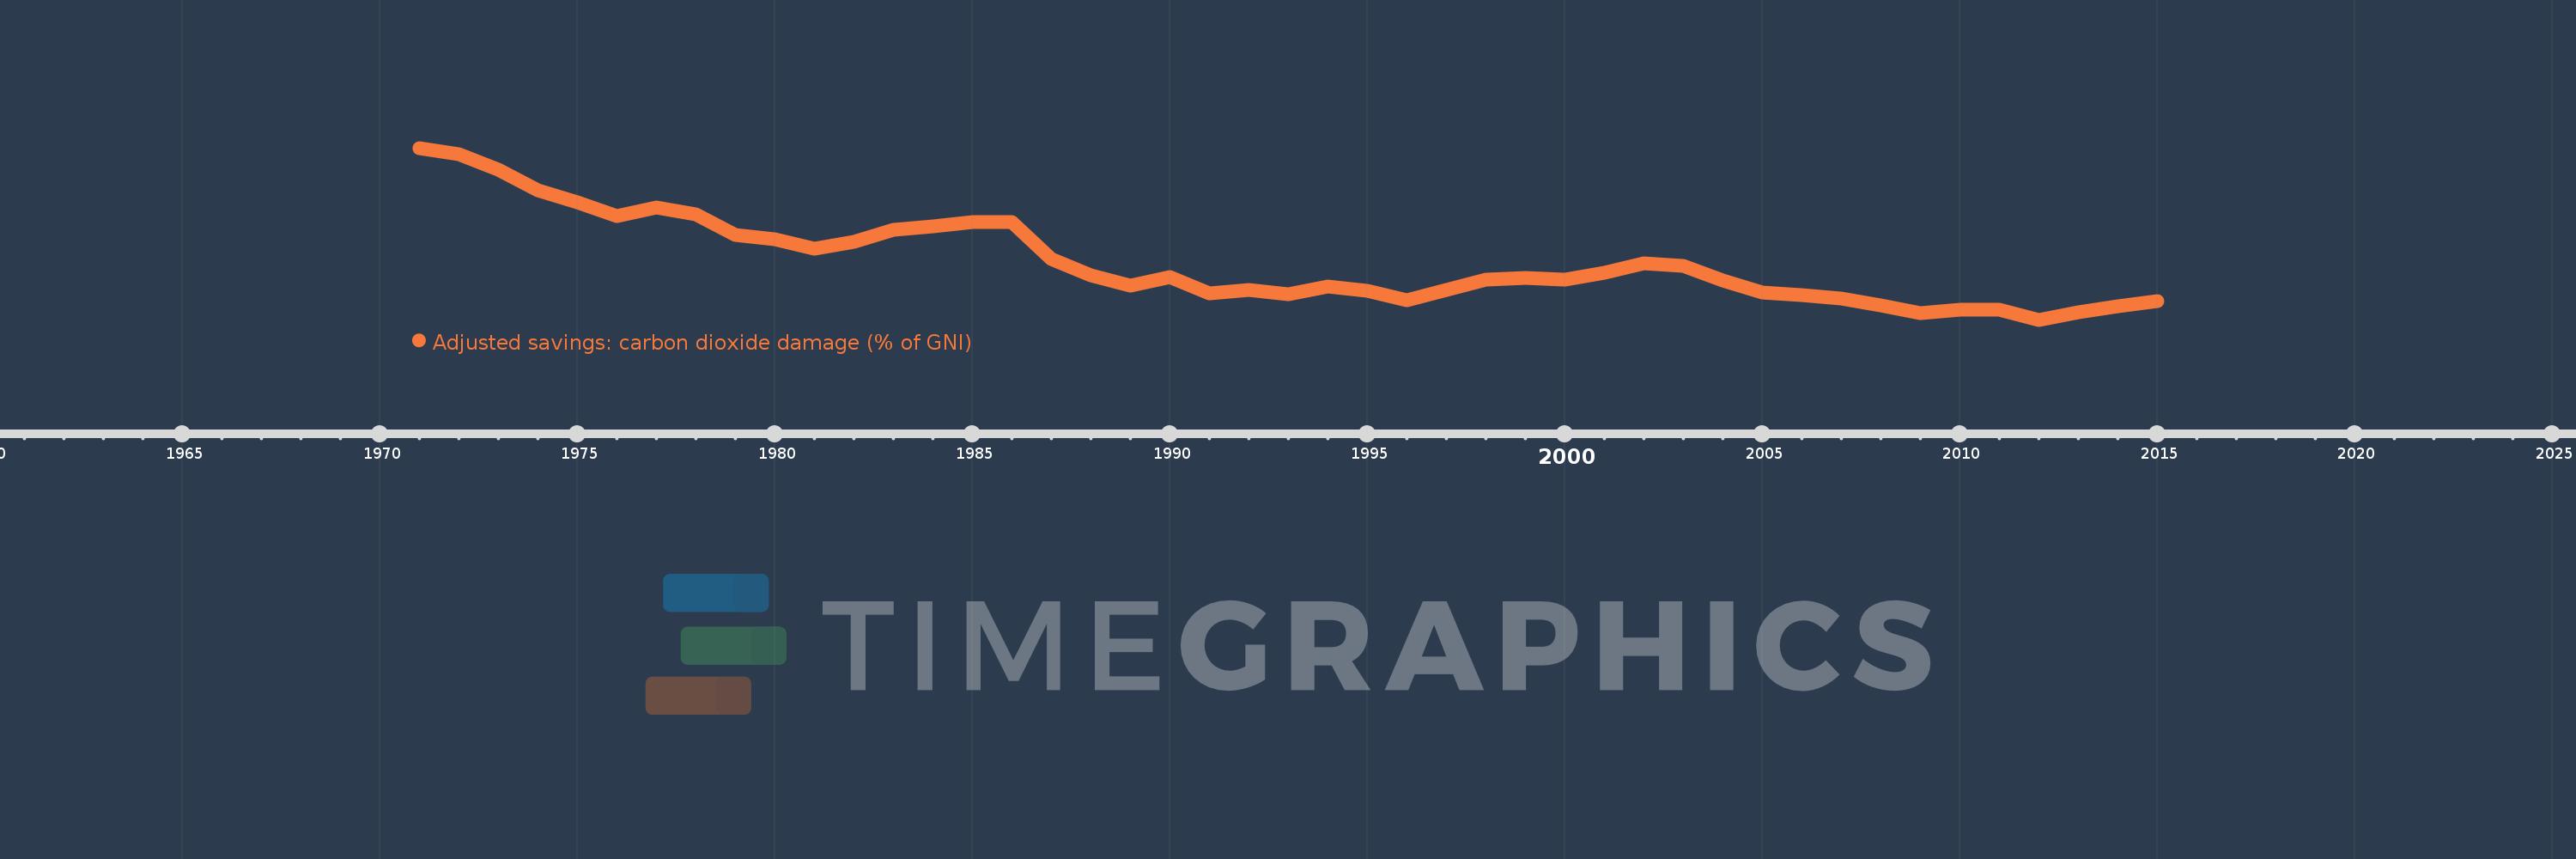
Adjusted savings: carbon dioxide damage (% of GNI)
2015,2014,2013,2012,2011,2010,2009,2008,2007,2006,2005,2004,2003,2002,2001,2000,1999,1998,1997,1996,1995,1994,1993,1992,1991,1990,1989,1988,1987,1986,1985,1984,1983,1982,1981,1980,1979,1978,1977,1976,1975,1974,1973,1972,1971
This statistics in other country:
AfghanistanAlbaniaAlgeriaAndorraAngolaAntigua and BarbudaArab WorldArgentinaArmeniaAustraliaAustriaAzerbaijanBahamas, TheBahrainBangladeshBarbadosBelarusBelgiumBelizeBeninBermudaBhutanBoliviaBosnia and HerzegovinaBotswanaBrazilBrunei DarussalamBulgariaBurkina FasoBurundiCabo VerdeCambodiaCameroonCanadaCaribbean small statesCentral African RepublicCentral Europe and the BalticsChadChileChinaColombiaComorosCongo, Dem. Rep.Congo, Rep.Costa RicaCote d'IvoireCroatiaCubaCyprusCzech RepublicDenmarkDjiboutiDominicaDominican RepublicEarly-demographic dividendEast Asia & PacificEast Asia & Pacific (excluding high income)East Asia & Pacific (IDA & IBRD countries)EcuadorEgypt, Arab Rep.El SalvadorEquatorial GuineaEritreaEstoniaEthiopiaEuro areaEurope & Central AsiaEurope & Central Asia (excluding high income)Europe & Central Asia (IDA & IBRD countries)European UnionFaroe IslandsFijiFinlandFragile and conflict affected situationsFranceFrench PolynesiaGabonGambia, TheGeorgiaGermanyGhanaGreeceGreenlandGrenadaGuatemalaGuineaGuinea-BissauGuyanaHaitiHeavily indebted poor countries (HIPC)High incomeHondurasHong Kong SAR, ChinaHungaryIBRD onlyIcelandIDA & IBRD totalIDA blendIDA onlyIDA totalIndiaIndonesiaIran, Islamic Rep.IraqIrelandIsraelItalyJamaicaJapanJordanKazakhstanKenyaKiribatiKorea, Rep.KuwaitKyrgyz RepublicLao PDRLate-demographic dividendLatin America & Caribbean Latin America & Caribbean (excluding high income)Latin America & the Caribbean (IDA & IBRD countries)LatviaLeast developed countries: UN classificationLebanonLesothoLiberiaLibyaLiechtensteinLithuaniaLow & middle incomeLow incomeLower middle incomeLuxembourgMacao SAR, ChinaMacedonia, FYRMadagascarMalawiMalaysiaMaldivesMaliMaltaMarshall IslandsMauritaniaMauritiusMexicoMicronesia, Fed. Sts.Middle East & North AfricaMiddle East & North Africa (excluding high income)Middle East & North Africa (IDA & IBRD countries)Middle incomeMoldovaMongoliaMontenegroMoroccoMozambiqueNamibiaNepalNetherlandsNew CaledoniaNew ZealandNicaraguaNigerNigeriaNorth AmericaNorwayOECD membersOmanOther small statesPacific island small statesPakistanPalauPanamaPapua New GuineaParaguayPeruPhilippinesPolandPortugalPost-demographic dividendPre-demographic dividendQatarRomaniaRussian FederationRwandaSamoaSao Tome and PrincipeSaudi ArabiaSenegalSerbiaSeychellesSierra LeoneSingaporeSlovak RepublicSloveniaSmall statesSolomon IslandsSouth AfricaSouth AsiaSouth Asia (IDA & IBRD)SpainSri LankaSt. Kitts and NevisSt. LuciaSt. Vincent and the GrenadinesSub-Saharan Africa Sub-Saharan Africa (excluding high income)Sub-Saharan Africa (IDA & IBRD countries)SudanSurinameSwazilandSwedenSwitzerlandSyrian Arab RepublicTajikistanTanzaniaThailandTimor-LesteTogoTongaTrinidad and TobagoTunisiaTurkeyTurkmenistanUgandaUkraineUnited Arab EmiratesUnited KingdomUnited StatesUpper middle incomeUruguayUzbekistanVanuatuVenezuela, RBVietnamWest Bank and GazaWorldYemen, Rep.ZambiaZimbabwe Timeline:
This timeline shows a graph from 1971 to 2015 of OECD members. No data until 1970. Number of actual observations by date: 45.
Source name:
World Development Indicators
Source organization:
World Bank staff estimates based on Samuel Fankhauser's "Valuing Climate Change: The Economics of the Greenhouse" (1995).
Categories, topics:
Economy & Growth, Environment
Last updated:
apr 23, 2017
Indicators value changes by year
At the date of observation
Value
Absolute change
Change from previous value
jan 1, 1972
0.491
-0.009
-1.77%
jan 1, 1973
0.469
-0.022
-4.46%
jan 1, 1974
0.439
-0.03
-6.41%
jan 1, 1975
0.421
-0.018
-4.04%
jan 1, 1976
0.401
-0.021
-4.93%
jan 1, 1977
0.414
+0.014
3.45%
jan 1, 1978
0.404
-0.011
-2.56%
jan 1, 1979
0.374
-0.03
-7.32%
jan 1, 1980
0.367
-0.008
-2.03%
jan 1, 1981
0.354
-0.013
-3.56%
jan 1, 1982
0.364
+0.011
3.01%
jan 1, 1983
0.381
+0.017
4.63%
jan 1, 1984
0.386
+0.005
1.24%
jan 1, 1985
0.392
+0.006
1.65%
jan 1, 1986
0.392
0.0
-0.02%
jan 1, 1987
0.339
-0.053
-13.56%
jan 1, 1988
0.315
-0.024
-7.2%
jan 1, 1989
0.3
-0.014
-4.5%
jan 1, 1990
0.312
+0.011
3.82%
jan 1, 1991
0.289
-0.023
-7.35%
jan 1, 1992
0.293
+0.004
1.5%
jan 1, 1993
0.287
-0.006
-2.01%
jan 1, 1994
0.298
+0.01
3.64%
jan 1, 1995
0.292
-0.006
-1.97%
jan 1, 1996
0.279
-0.013
-4.58%
jan 1, 1997
0.293
+0.014
5.03%
jan 1, 1998
0.308
+0.015
5.16%
jan 1, 1999
0.311
+0.003
1.03%
jan 1, 2000
0.308
-0.003
-0.96%
jan 1, 2001
0.319
+0.011
3.73%
jan 1, 2002
0.332
+0.012
3.85%
jan 1, 2003
0.329
-0.003
-0.94%
jan 1, 2004
0.307
-0.021
-6.51%
jan 1, 2005
0.29
-0.017
-5.66%
jan 1, 2006
0.286
-0.003
-1.18%
jan 1, 2007
0.281
-0.006
-1.94%
jan 1, 2008
0.271
-0.01
-3.53%
jan 1, 2009
0.26
-0.011
-4.14%
jan 1, 2010
0.265
+0.005
1.87%
jan 1, 2011
0.265
+0.0
0.08%
jan 1, 2012
0.25
-0.015
-5.53%
jan 1, 2013
0.261
+0.011
4.42%
jan 1, 2014
0.27
+0.009
3.3%
jan 1, 2015
0.277
+0.007
2.65%
Ranking of countries by current statistics by years


Comments: