29
/
en
AIzaSyAYiBZKx7MnpbEhh9jyipgxe19OcubqV5w
April 1, 2024
147592
Guyana
GUY
true
2
1
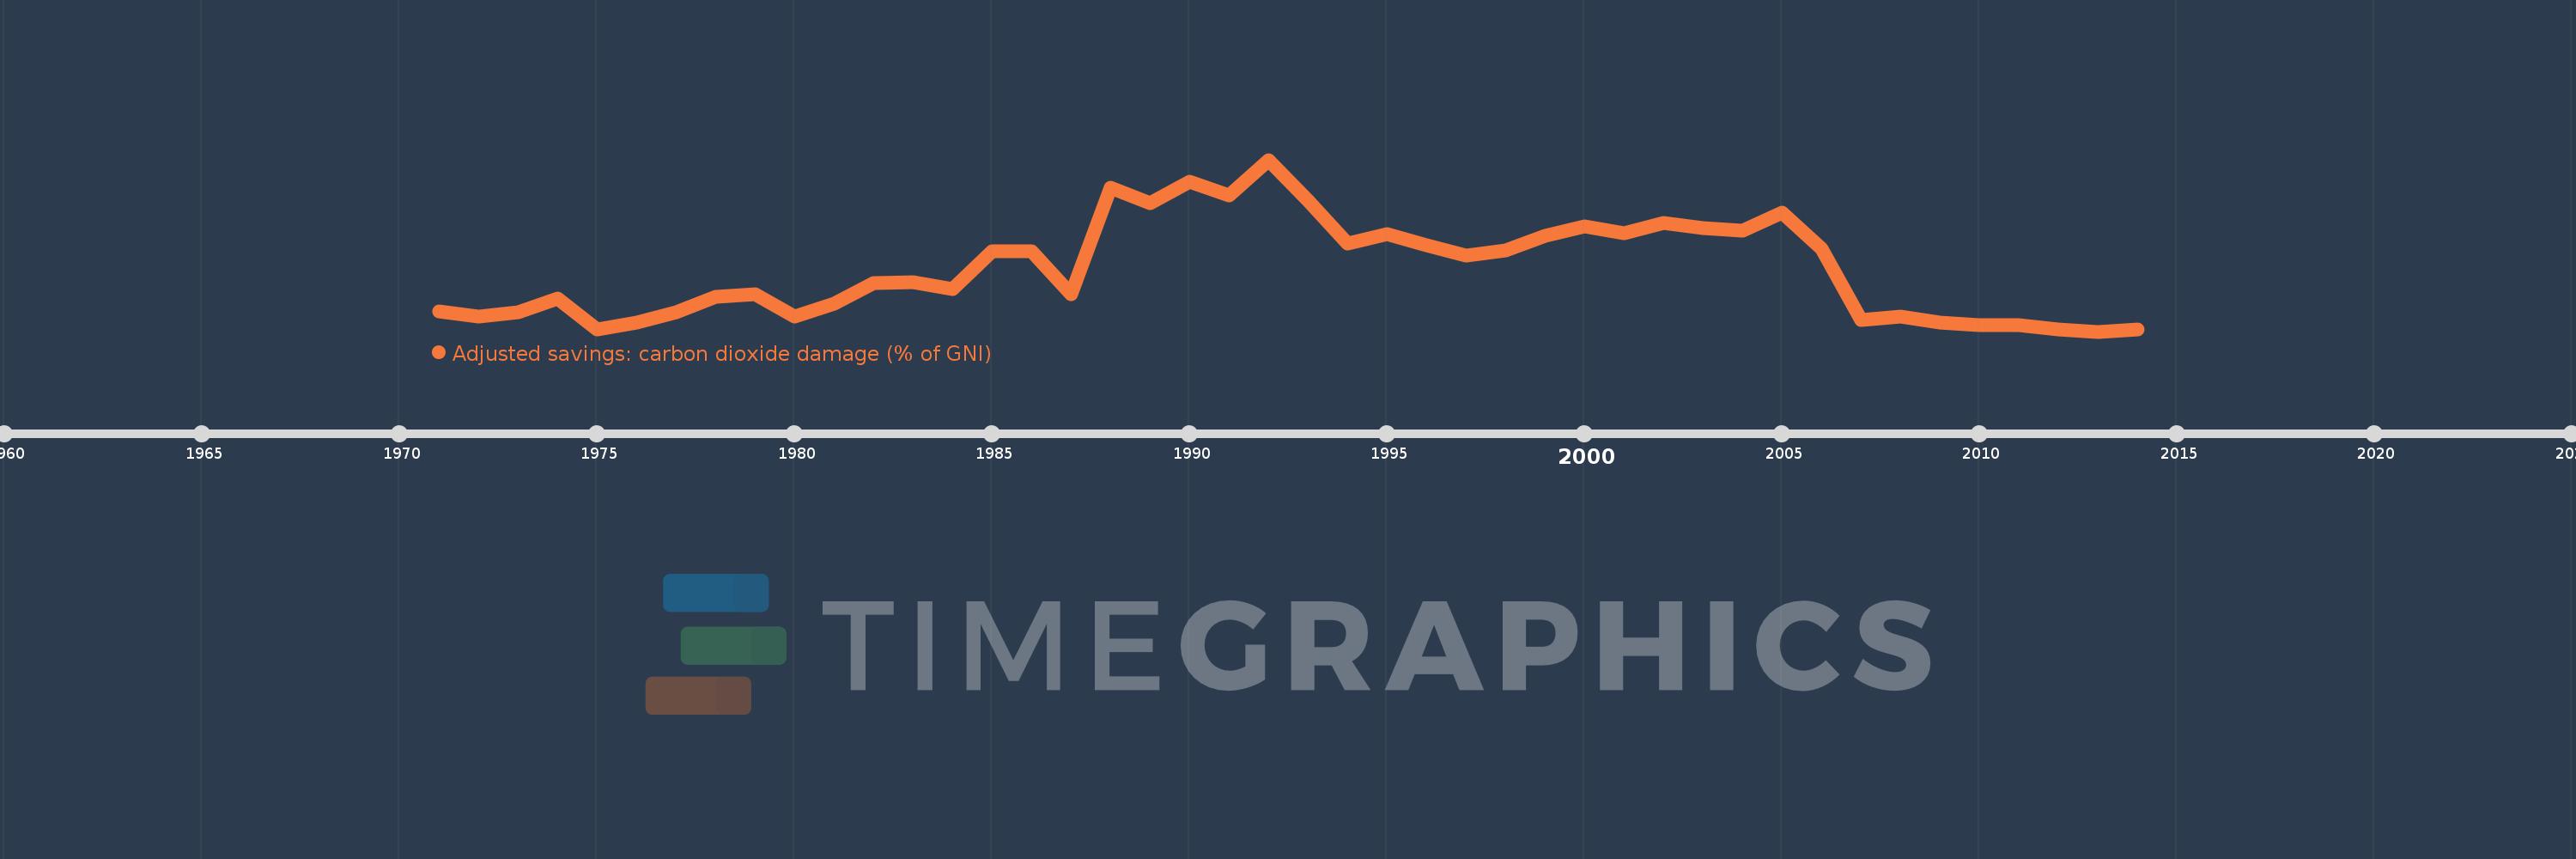
Adjusted savings: carbon dioxide damage (% of GNI)
2014,2013,2012,2011,2010,2009,2008,2007,2006,2005,2004,2003,2002,2001,2000,1999,1998,1997,1996,1995,1994,1993,1992,1991,1990,1989,1988,1987,1986,1985,1984,1983,1982,1981,1980,1979,1978,1977,1976,1975,1974,1973,1972,1971
This statistics in other country:
AfghanistanAlbaniaAlgeriaAndorraAngolaAntigua and BarbudaArab WorldArgentinaArmeniaAustraliaAustriaAzerbaijanBahamas, TheBahrainBangladeshBarbadosBelarusBelgiumBelizeBeninBermudaBhutanBoliviaBosnia and HerzegovinaBotswanaBrazilBrunei DarussalamBulgariaBurkina FasoBurundiCabo VerdeCambodiaCameroonCanadaCaribbean small statesCentral African RepublicCentral Europe and the BalticsChadChileChinaColombiaComorosCongo, Dem. Rep.Congo, Rep.Costa RicaCote d'IvoireCroatiaCubaCyprusCzech RepublicDenmarkDjiboutiDominicaDominican RepublicEarly-demographic dividendEast Asia & PacificEast Asia & Pacific (excluding high income)East Asia & Pacific (IDA & IBRD countries)EcuadorEgypt, Arab Rep.El SalvadorEquatorial GuineaEritreaEstoniaEthiopiaEuro areaEurope & Central AsiaEurope & Central Asia (excluding high income)Europe & Central Asia (IDA & IBRD countries)European UnionFaroe IslandsFijiFinlandFragile and conflict affected situationsFranceFrench PolynesiaGabonGambia, TheGeorgiaGermanyGhanaGreeceGreenlandGrenadaGuatemalaGuineaGuinea-BissauGuyanaHaitiHeavily indebted poor countries (HIPC)High incomeHondurasHong Kong SAR, ChinaHungaryIBRD onlyIcelandIDA & IBRD totalIDA blendIDA onlyIDA totalIndiaIndonesiaIran, Islamic Rep.IraqIrelandIsraelItalyJamaicaJapanJordanKazakhstanKenyaKiribatiKorea, Rep.KuwaitKyrgyz RepublicLao PDRLate-demographic dividendLatin America & Caribbean Latin America & Caribbean (excluding high income)Latin America & the Caribbean (IDA & IBRD countries)LatviaLeast developed countries: UN classificationLebanonLesothoLiberiaLibyaLiechtensteinLithuaniaLow & middle incomeLow incomeLower middle incomeLuxembourgMacao SAR, ChinaMacedonia, FYRMadagascarMalawiMalaysiaMaldivesMaliMaltaMarshall IslandsMauritaniaMauritiusMexicoMicronesia, Fed. Sts.Middle East & North AfricaMiddle East & North Africa (excluding high income)Middle East & North Africa (IDA & IBRD countries)Middle incomeMoldovaMongoliaMontenegroMoroccoMozambiqueNamibiaNepalNetherlandsNew CaledoniaNew ZealandNicaraguaNigerNigeriaNorth AmericaNorwayOECD membersOmanOther small statesPacific island small statesPakistanPalauPanamaPapua New GuineaParaguayPeruPhilippinesPolandPortugalPost-demographic dividendPre-demographic dividendQatarRomaniaRussian FederationRwandaSamoaSao Tome and PrincipeSaudi ArabiaSenegalSerbiaSeychellesSierra LeoneSingaporeSlovak RepublicSloveniaSmall statesSolomon IslandsSouth AfricaSouth AsiaSouth Asia (IDA & IBRD)SpainSri LankaSt. Kitts and NevisSt. LuciaSt. Vincent and the GrenadinesSub-Saharan Africa Sub-Saharan Africa (excluding high income)Sub-Saharan Africa (IDA & IBRD countries)SudanSurinameSwazilandSwedenSwitzerlandSyrian Arab RepublicTajikistanTanzaniaThailandTimor-LesteTogoTongaTrinidad and TobagoTunisiaTurkeyTurkmenistanUgandaUkraineUnited Arab EmiratesUnited KingdomUnited StatesUpper middle incomeUruguayUzbekistanVanuatuVenezuela, RBVietnamWest Bank and GazaWorldYemen, Rep.ZambiaZimbabwe Timeline:
This timeline shows a graph from 1971 to 2014 of Guyana. No data until 1970. Number of actual observations by date: 44.
Source name:
World Development Indicators
Source organization:
World Bank staff estimates based on Samuel Fankhauser's "Valuing Climate Change: The Economics of the Greenhouse" (1995).
Categories, topics:
Economy & Growth, Environment
Last updated:
apr 23, 2017
Indicators value changes by year
At the date of observation
Value
Absolute change
Change from previous value
jan 1, 1971
0.856
+0.856
0.0%
jan 1, 1972
0.806
-0.05
-5.8%
jan 1, 1973
0.851
+0.045
5.64%
jan 1, 1974
0.987
+0.136
15.97%
jan 1, 1975
0.666
-0.322
-32.59%
jan 1, 1976
0.739
+0.074
11.08%
jan 1, 1977
0.847
+0.108
14.57%
jan 1, 1978
1.003
+0.156
18.4%
jan 1, 1979
1.034
+0.031
3.08%
jan 1, 1980
0.807
-0.227
-21.95%
jan 1, 1981
0.932
+0.125
15.47%
jan 1, 1982
1.146
+0.214
22.99%
jan 1, 1983
1.16
+0.015
1.27%
jan 1, 1984
1.085
-0.075
-6.49%
jan 1, 1985
1.475
+0.389
35.89%
jan 1, 1986
1.473
-0.001
-0.09%
jan 1, 1987
1.034
-0.439
-29.8%
jan 1, 1988
2.134
+1.1
106.38%
jan 1, 1989
1.972
-0.162
-7.6%
jan 1, 1990
2.197
+0.225
11.39%
jan 1, 1991
2.048
-0.149
-6.77%
jan 1, 1992
2.42
+0.372
18.16%
jan 1, 1993
1.999
-0.422
-17.42%
jan 1, 1994
1.559
-0.44
-22.02%
jan 1, 1995
1.656
+0.097
6.24%
jan 1, 1996
1.536
-0.12
-7.25%
jan 1, 1997
1.431
-0.104
-6.79%
jan 1, 1998
1.488
+0.057
3.98%
jan 1, 1999
1.639
+0.151
10.14%
jan 1, 2000
1.732
+0.093
5.67%
jan 1, 2001
1.66
-0.073
-4.19%
jan 1, 2002
1.765
+0.105
6.31%
jan 1, 2003
1.715
-0.049
-2.8%
jan 1, 2004
1.693
-0.023
-1.32%
jan 1, 2005
1.871
+0.179
10.56%
jan 1, 2006
1.5
-0.371
-19.84%
jan 1, 2007
0.77
-0.73
-48.65%
jan 1, 2008
0.803
+0.032
4.18%
jan 1, 2009
0.737
-0.066
-8.16%
jan 1, 2010
0.716
-0.021
-2.84%
jan 1, 2011
0.711
-0.005
-0.67%
jan 1, 2012
0.673
-0.039
-5.41%
jan 1, 2013
0.648
-0.025
-3.72%
jan 1, 2014
0.668
+0.02
3.05%
Ranking of countries by current statistics by years


Comments: