29
/
en
AIzaSyAYiBZKx7MnpbEhh9jyipgxe19OcubqV5w
April 1, 2024
219259
Papua New Guinea
PNG
true
2
1
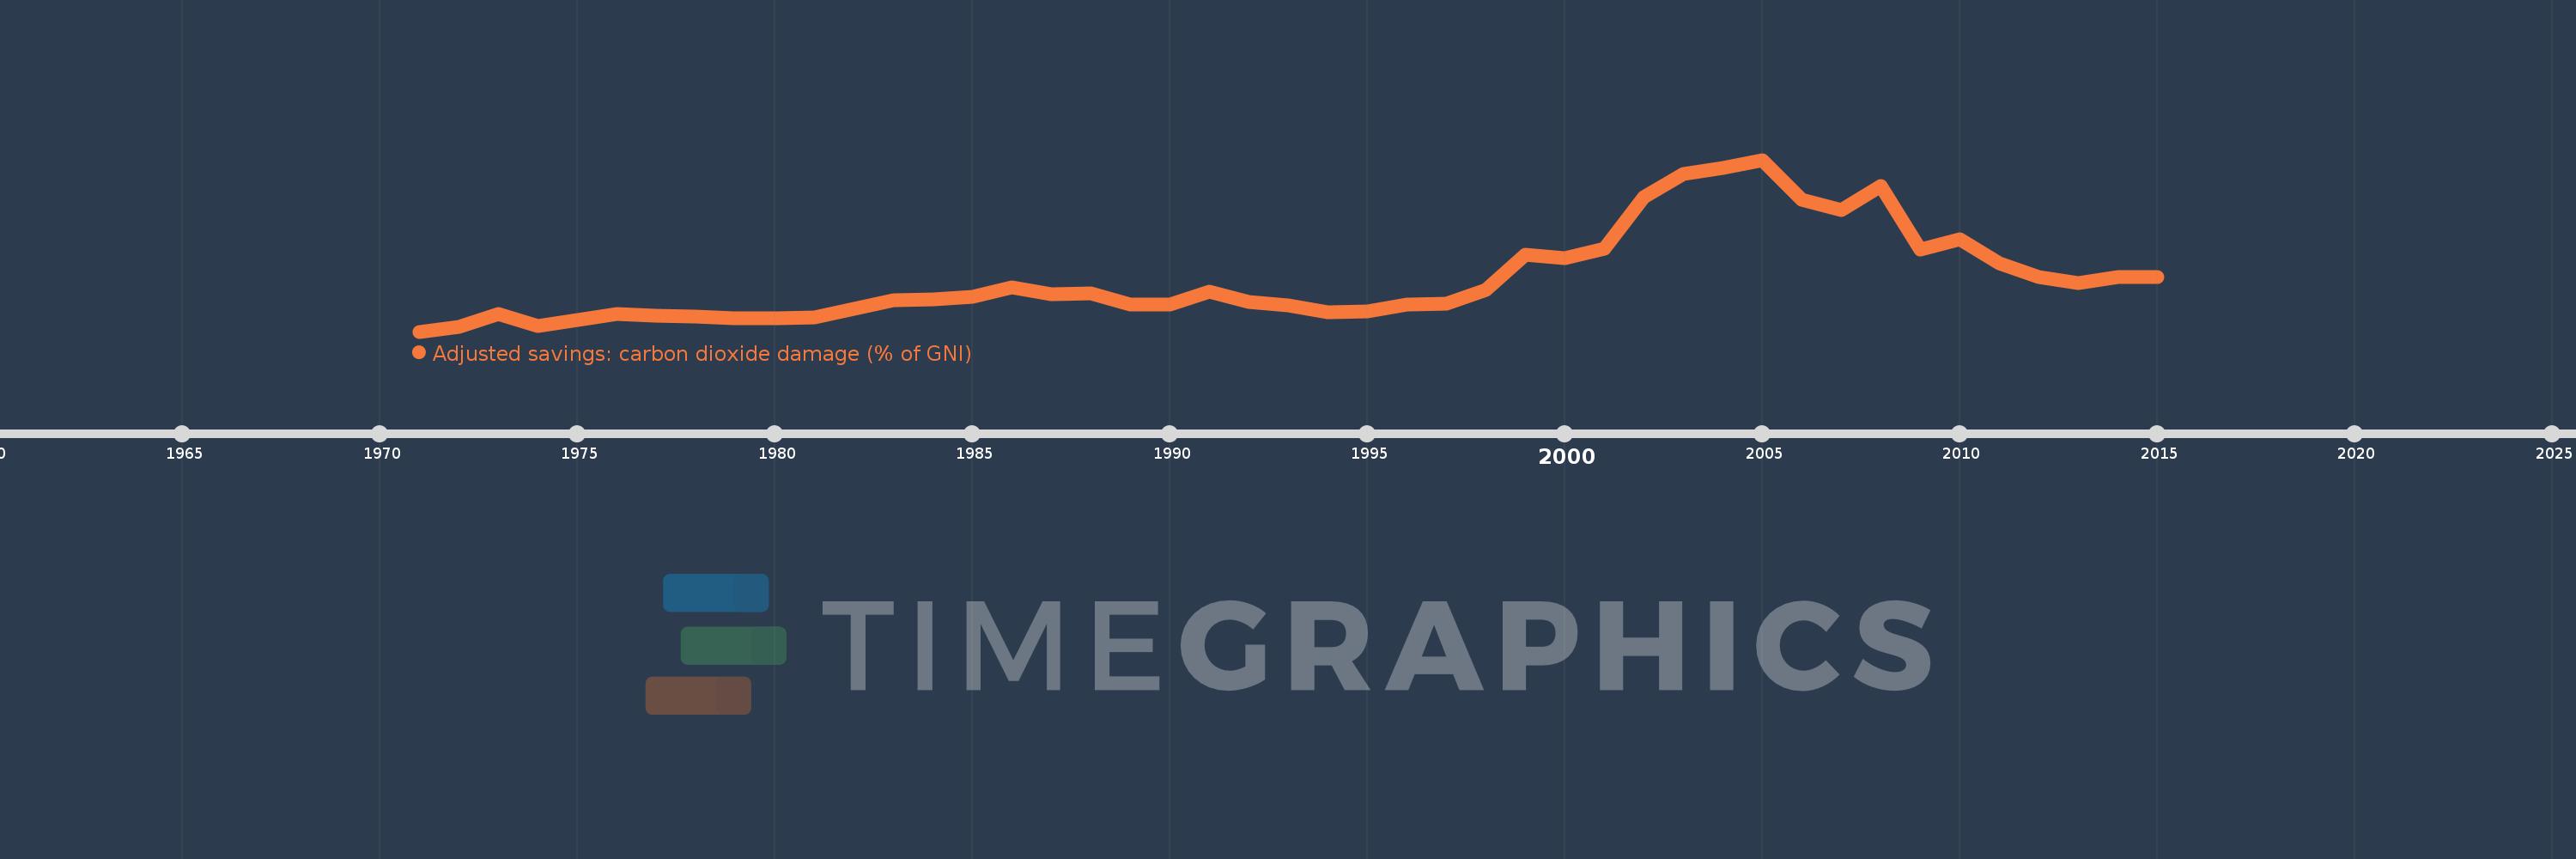
Adjusted savings: carbon dioxide damage (% of GNI)
2015,2014,2013,2012,2011,2010,2009,2008,2007,2006,2005,2004,2003,2002,2001,2000,1999,1998,1997,1996,1995,1994,1993,1992,1991,1990,1989,1988,1987,1986,1985,1984,1983,1982,1981,1980,1979,1978,1977,1976,1975,1974,1973,1972,1971
This statistics in other country:
AfghanistanAlbaniaAlgeriaAndorraAngolaAntigua and BarbudaArab WorldArgentinaArmeniaAustraliaAustriaAzerbaijanBahamas, TheBahrainBangladeshBarbadosBelarusBelgiumBelizeBeninBermudaBhutanBoliviaBosnia and HerzegovinaBotswanaBrazilBrunei DarussalamBulgariaBurkina FasoBurundiCabo VerdeCambodiaCameroonCanadaCaribbean small statesCentral African RepublicCentral Europe and the BalticsChadChileChinaColombiaComorosCongo, Dem. Rep.Congo, Rep.Costa RicaCote d'IvoireCroatiaCubaCyprusCzech RepublicDenmarkDjiboutiDominicaDominican RepublicEarly-demographic dividendEast Asia & PacificEast Asia & Pacific (excluding high income)East Asia & Pacific (IDA & IBRD countries)EcuadorEgypt, Arab Rep.El SalvadorEquatorial GuineaEritreaEstoniaEthiopiaEuro areaEurope & Central AsiaEurope & Central Asia (excluding high income)Europe & Central Asia (IDA & IBRD countries)European UnionFaroe IslandsFijiFinlandFragile and conflict affected situationsFranceFrench PolynesiaGabonGambia, TheGeorgiaGermanyGhanaGreeceGreenlandGrenadaGuatemalaGuineaGuinea-BissauGuyanaHaitiHeavily indebted poor countries (HIPC)High incomeHondurasHong Kong SAR, ChinaHungaryIBRD onlyIcelandIDA & IBRD totalIDA blendIDA onlyIDA totalIndiaIndonesiaIran, Islamic Rep.IraqIrelandIsraelItalyJamaicaJapanJordanKazakhstanKenyaKiribatiKorea, Rep.KuwaitKyrgyz RepublicLao PDRLate-demographic dividendLatin America & Caribbean Latin America & Caribbean (excluding high income)Latin America & the Caribbean (IDA & IBRD countries)LatviaLeast developed countries: UN classificationLebanonLesothoLiberiaLibyaLiechtensteinLithuaniaLow & middle incomeLow incomeLower middle incomeLuxembourgMacao SAR, ChinaMacedonia, FYRMadagascarMalawiMalaysiaMaldivesMaliMaltaMarshall IslandsMauritaniaMauritiusMexicoMicronesia, Fed. Sts.Middle East & North AfricaMiddle East & North Africa (excluding high income)Middle East & North Africa (IDA & IBRD countries)Middle incomeMoldovaMongoliaMontenegroMoroccoMozambiqueNamibiaNepalNetherlandsNew CaledoniaNew ZealandNicaraguaNigerNigeriaNorth AmericaNorwayOECD membersOmanOther small statesPacific island small statesPakistanPalauPanamaPapua New GuineaParaguayPeruPhilippinesPolandPortugalPost-demographic dividendPre-demographic dividendQatarRomaniaRussian FederationRwandaSamoaSao Tome and PrincipeSaudi ArabiaSenegalSerbiaSeychellesSierra LeoneSingaporeSlovak RepublicSloveniaSmall statesSolomon IslandsSouth AfricaSouth AsiaSouth Asia (IDA & IBRD)SpainSri LankaSt. Kitts and NevisSt. LuciaSt. Vincent and the GrenadinesSub-Saharan Africa Sub-Saharan Africa (excluding high income)Sub-Saharan Africa (IDA & IBRD countries)SudanSurinameSwazilandSwedenSwitzerlandSyrian Arab RepublicTajikistanTanzaniaThailandTimor-LesteTogoTongaTrinidad and TobagoTunisiaTurkeyTurkmenistanUgandaUkraineUnited Arab EmiratesUnited KingdomUnited StatesUpper middle incomeUruguayUzbekistanVanuatuVenezuela, RBVietnamWest Bank and GazaWorldYemen, Rep.ZambiaZimbabwe Timeline:
This timeline shows a graph from 1971 to 2015 of Papua New Guinea. No data until 1970. Number of actual observations by date: 45.
Source name:
World Development Indicators
Source organization:
World Bank staff estimates based on Samuel Fankhauser's "Valuing Climate Change: The Economics of the Greenhouse" (1995).
Categories, topics:
Economy & Growth, Environment
Last updated:
apr 23, 2017
Indicators value changes by year
At the date of observation
Value
Absolute change
Change from previous value
jan 1, 1971
0.148
+0.148
0.0%
jan 1, 1972
0.172
+0.024
16.04%
jan 1, 1973
0.233
+0.062
35.9%
jan 1, 1974
0.177
-0.056
-24.19%
jan 1, 1975
0.206
+0.029
16.45%
jan 1, 1976
0.232
+0.027
12.98%
jan 1, 1977
0.224
-0.009
-3.71%
jan 1, 1978
0.22
-0.004
-1.86%
jan 1, 1979
0.211
-0.009
-3.93%
jan 1, 1980
0.212
+0.001
0.68%
jan 1, 1981
0.215
+0.003
1.21%
jan 1, 1982
0.259
+0.044
20.48%
jan 1, 1983
0.301
+0.042
16.04%
jan 1, 1984
0.303
+0.003
0.89%
jan 1, 1985
0.317
+0.013
4.44%
jan 1, 1986
0.364
+0.047
14.89%
jan 1, 1987
0.331
-0.033
-9.12%
jan 1, 1988
0.333
+0.002
0.71%
jan 1, 1989
0.28
-0.053
-15.82%
jan 1, 1990
0.281
+0.0
0.15%
jan 1, 1991
0.342
+0.061
21.67%
jan 1, 1992
0.291
-0.051
-14.82%
jan 1, 1993
0.276
-0.015
-5.24%
jan 1, 1994
0.243
-0.033
-11.83%
jan 1, 1995
0.245
+0.002
0.68%
jan 1, 1996
0.279
+0.034
13.79%
jan 1, 1997
0.284
+0.005
1.87%
jan 1, 1998
0.35
+0.066
23.32%
jan 1, 1999
0.521
+0.171
48.74%
jan 1, 2000
0.504
-0.016
-3.15%
jan 1, 2001
0.55
+0.045
8.99%
jan 1, 2002
0.799
+0.249
45.27%
jan 1, 2003
0.91
+0.112
13.98%
jan 1, 2004
0.942
+0.032
3.47%
jan 1, 2005
0.98
+0.038
4.0%
jan 1, 2006
0.785
-0.194
-19.85%
jan 1, 2007
0.737
-0.048
-6.15%
jan 1, 2008
0.855
+0.118
15.99%
jan 1, 2009
0.546
-0.309
-36.15%
jan 1, 2010
0.595
+0.049
8.98%
jan 1, 2011
0.48
-0.114
-19.22%
jan 1, 2012
0.411
-0.069
-14.39%
jan 1, 2013
0.384
-0.027
-6.56%
jan 1, 2014
0.413
+0.029
7.46%
jan 1, 2015
0.411
-0.002
-0.57%
Ranking of countries by current statistics by years


Comments: