29
/
en
AIzaSyAYiBZKx7MnpbEhh9jyipgxe19OcubqV5w
April 1, 2024
240171
Singapore
SGP
true
2
1
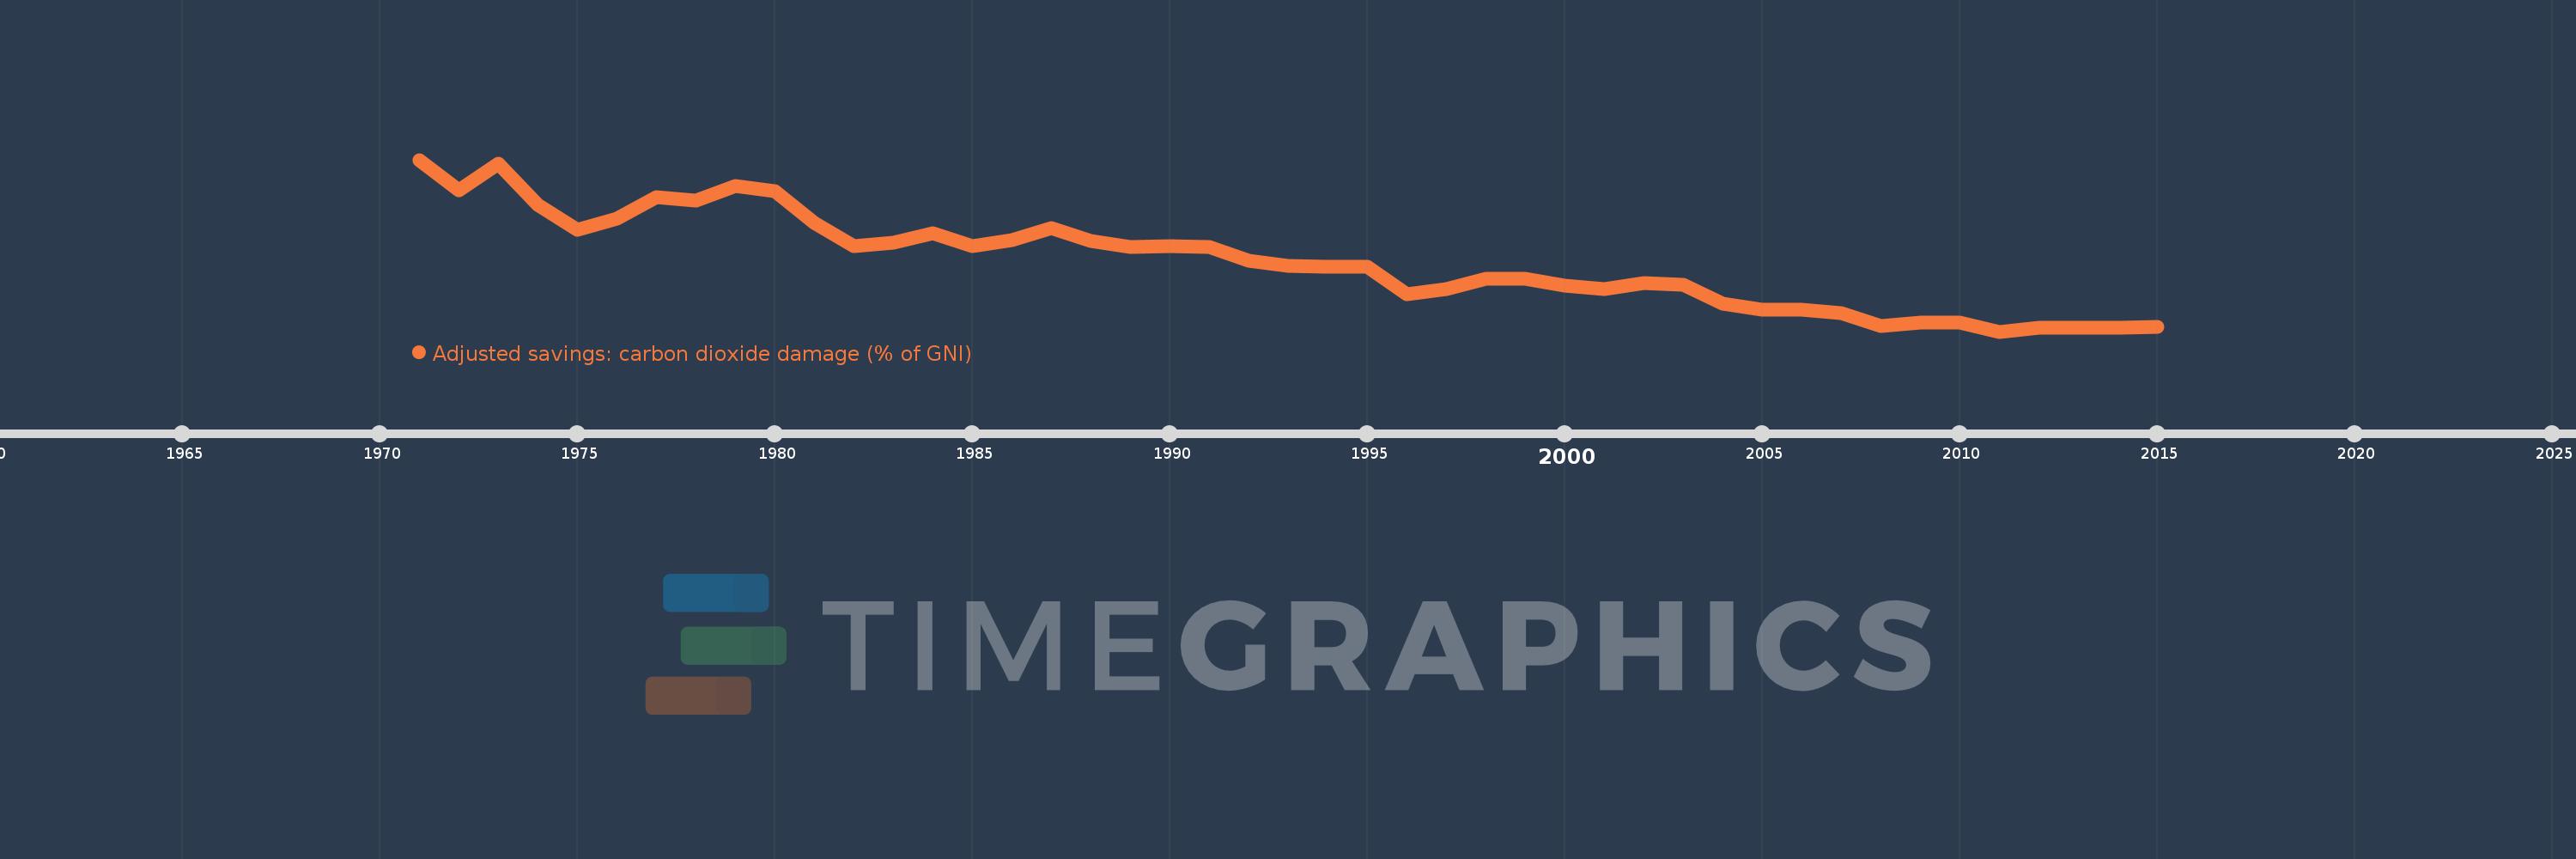
Adjusted savings: carbon dioxide damage (% of GNI)
2015,2014,2013,2012,2011,2010,2009,2008,2007,2006,2005,2004,2003,2002,2001,2000,1999,1998,1997,1996,1995,1994,1993,1992,1991,1990,1989,1988,1987,1986,1985,1984,1983,1982,1981,1980,1979,1978,1977,1976,1975,1974,1973,1972,1971
This statistics in other country:
AfghanistanAlbaniaAlgeriaAndorraAngolaAntigua and BarbudaArab WorldArgentinaArmeniaAustraliaAustriaAzerbaijanBahamas, TheBahrainBangladeshBarbadosBelarusBelgiumBelizeBeninBermudaBhutanBoliviaBosnia and HerzegovinaBotswanaBrazilBrunei DarussalamBulgariaBurkina FasoBurundiCabo VerdeCambodiaCameroonCanadaCaribbean small statesCentral African RepublicCentral Europe and the BalticsChadChileChinaColombiaComorosCongo, Dem. Rep.Congo, Rep.Costa RicaCote d'IvoireCroatiaCubaCyprusCzech RepublicDenmarkDjiboutiDominicaDominican RepublicEarly-demographic dividendEast Asia & PacificEast Asia & Pacific (excluding high income)East Asia & Pacific (IDA & IBRD countries)EcuadorEgypt, Arab Rep.El SalvadorEquatorial GuineaEritreaEstoniaEthiopiaEuro areaEurope & Central AsiaEurope & Central Asia (excluding high income)Europe & Central Asia (IDA & IBRD countries)European UnionFaroe IslandsFijiFinlandFragile and conflict affected situationsFranceFrench PolynesiaGabonGambia, TheGeorgiaGermanyGhanaGreeceGreenlandGrenadaGuatemalaGuineaGuinea-BissauGuyanaHaitiHeavily indebted poor countries (HIPC)High incomeHondurasHong Kong SAR, ChinaHungaryIBRD onlyIcelandIDA & IBRD totalIDA blendIDA onlyIDA totalIndiaIndonesiaIran, Islamic Rep.IraqIrelandIsraelItalyJamaicaJapanJordanKazakhstanKenyaKiribatiKorea, Rep.KuwaitKyrgyz RepublicLao PDRLate-demographic dividendLatin America & Caribbean Latin America & Caribbean (excluding high income)Latin America & the Caribbean (IDA & IBRD countries)LatviaLeast developed countries: UN classificationLebanonLesothoLiberiaLibyaLiechtensteinLithuaniaLow & middle incomeLow incomeLower middle incomeLuxembourgMacao SAR, ChinaMacedonia, FYRMadagascarMalawiMalaysiaMaldivesMaliMaltaMarshall IslandsMauritaniaMauritiusMexicoMicronesia, Fed. Sts.Middle East & North AfricaMiddle East & North Africa (excluding high income)Middle East & North Africa (IDA & IBRD countries)Middle incomeMoldovaMongoliaMontenegroMoroccoMozambiqueNamibiaNepalNetherlandsNew CaledoniaNew ZealandNicaraguaNigerNigeriaNorth AmericaNorwayOECD membersOmanOther small statesPacific island small statesPakistanPalauPanamaPapua New GuineaParaguayPeruPhilippinesPolandPortugalPost-demographic dividendPre-demographic dividendQatarRomaniaRussian FederationRwandaSamoaSao Tome and PrincipeSaudi ArabiaSenegalSerbiaSeychellesSierra LeoneSingaporeSlovak RepublicSloveniaSmall statesSolomon IslandsSouth AfricaSouth AsiaSouth Asia (IDA & IBRD)SpainSri LankaSt. Kitts and NevisSt. LuciaSt. Vincent and the GrenadinesSub-Saharan Africa Sub-Saharan Africa (excluding high income)Sub-Saharan Africa (IDA & IBRD countries)SudanSurinameSwazilandSwedenSwitzerlandSyrian Arab RepublicTajikistanTanzaniaThailandTimor-LesteTogoTongaTrinidad and TobagoTunisiaTurkeyTurkmenistanUgandaUkraineUnited Arab EmiratesUnited KingdomUnited StatesUpper middle incomeUruguayUzbekistanVanuatuVenezuela, RBVietnamWest Bank and GazaWorldYemen, Rep.ZambiaZimbabwe Timeline:
This timeline shows a graph from 1971 to 2015 of Singapore. No data until 1970. Number of actual observations by date: 45.
Source name:
World Development Indicators
Source organization:
World Bank staff estimates based on Samuel Fankhauser's "Valuing Climate Change: The Economics of the Greenhouse" (1995).
Categories, topics:
Economy & Growth, Environment
Last updated:
apr 23, 2017
Indicators value changes by year
At the date of observation
Value
Absolute change
Change from previous value
jan 1, 1971
1.254
+1.254
0.0%
jan 1, 1972
1.042
-0.212
-16.91%
jan 1, 1973
1.228
+0.186
17.81%
jan 1, 1974
0.938
-0.29
-23.59%
jan 1, 1975
0.763
-0.175
-18.69%
jan 1, 1976
0.841
+0.078
10.25%
jan 1, 1977
0.992
+0.151
17.99%
jan 1, 1978
0.967
-0.026
-2.59%
jan 1, 1979
1.07
+0.103
10.67%
jan 1, 1980
1.033
-0.036
-3.4%
jan 1, 1981
0.814
-0.219
-21.23%
jan 1, 1982
0.65
-0.164
-20.18%
jan 1, 1983
0.677
+0.027
4.15%
jan 1, 1984
0.74
+0.063
9.31%
jan 1, 1985
0.652
-0.088
-11.89%
jan 1, 1986
0.692
+0.04
6.15%
jan 1, 1987
0.778
+0.086
12.39%
jan 1, 1988
0.685
-0.092
-11.85%
jan 1, 1989
0.647
-0.038
-5.56%
jan 1, 1990
0.652
+0.005
0.79%
jan 1, 1991
0.648
-0.004
-0.66%
jan 1, 1992
0.547
-0.101
-15.6%
jan 1, 1993
0.515
-0.032
-5.87%
jan 1, 1994
0.51
-0.005
-1.04%
jan 1, 1995
0.506
-0.003
-0.64%
jan 1, 1996
0.314
-0.192
-37.88%
jan 1, 1997
0.352
+0.037
11.86%
jan 1, 1998
0.425
+0.073
20.74%
jan 1, 1999
0.422
-0.003
-0.63%
jan 1, 2000
0.378
-0.044
-10.53%
jan 1, 2001
0.35
-0.027
-7.21%
jan 1, 2002
0.395
+0.045
12.77%
jan 1, 2003
0.383
-0.013
-3.18%
jan 1, 2004
0.248
-0.134
-35.08%
jan 1, 2005
0.208
-0.04
-16.13%
jan 1, 2006
0.207
-0.002
-0.74%
jan 1, 2007
0.182
-0.024
-11.8%
jan 1, 2008
0.091
-0.091
-49.88%
jan 1, 2009
0.117
+0.026
28.23%
jan 1, 2010
0.119
+0.002
1.79%
jan 1, 2011
0.054
-0.065
-54.84%
jan 1, 2012
0.081
+0.027
49.69%
jan 1, 2013
0.082
+0.001
1.69%
jan 1, 2014
0.084
+0.002
2.91%
jan 1, 2015
0.087
+0.003
3.54%
Ranking of countries by current statistics by years


Comments: