29
/
en
AIzaSyAYiBZKx7MnpbEhh9jyipgxe19OcubqV5w
April 1, 2024
135157
Gabon
GAB
true
2
1
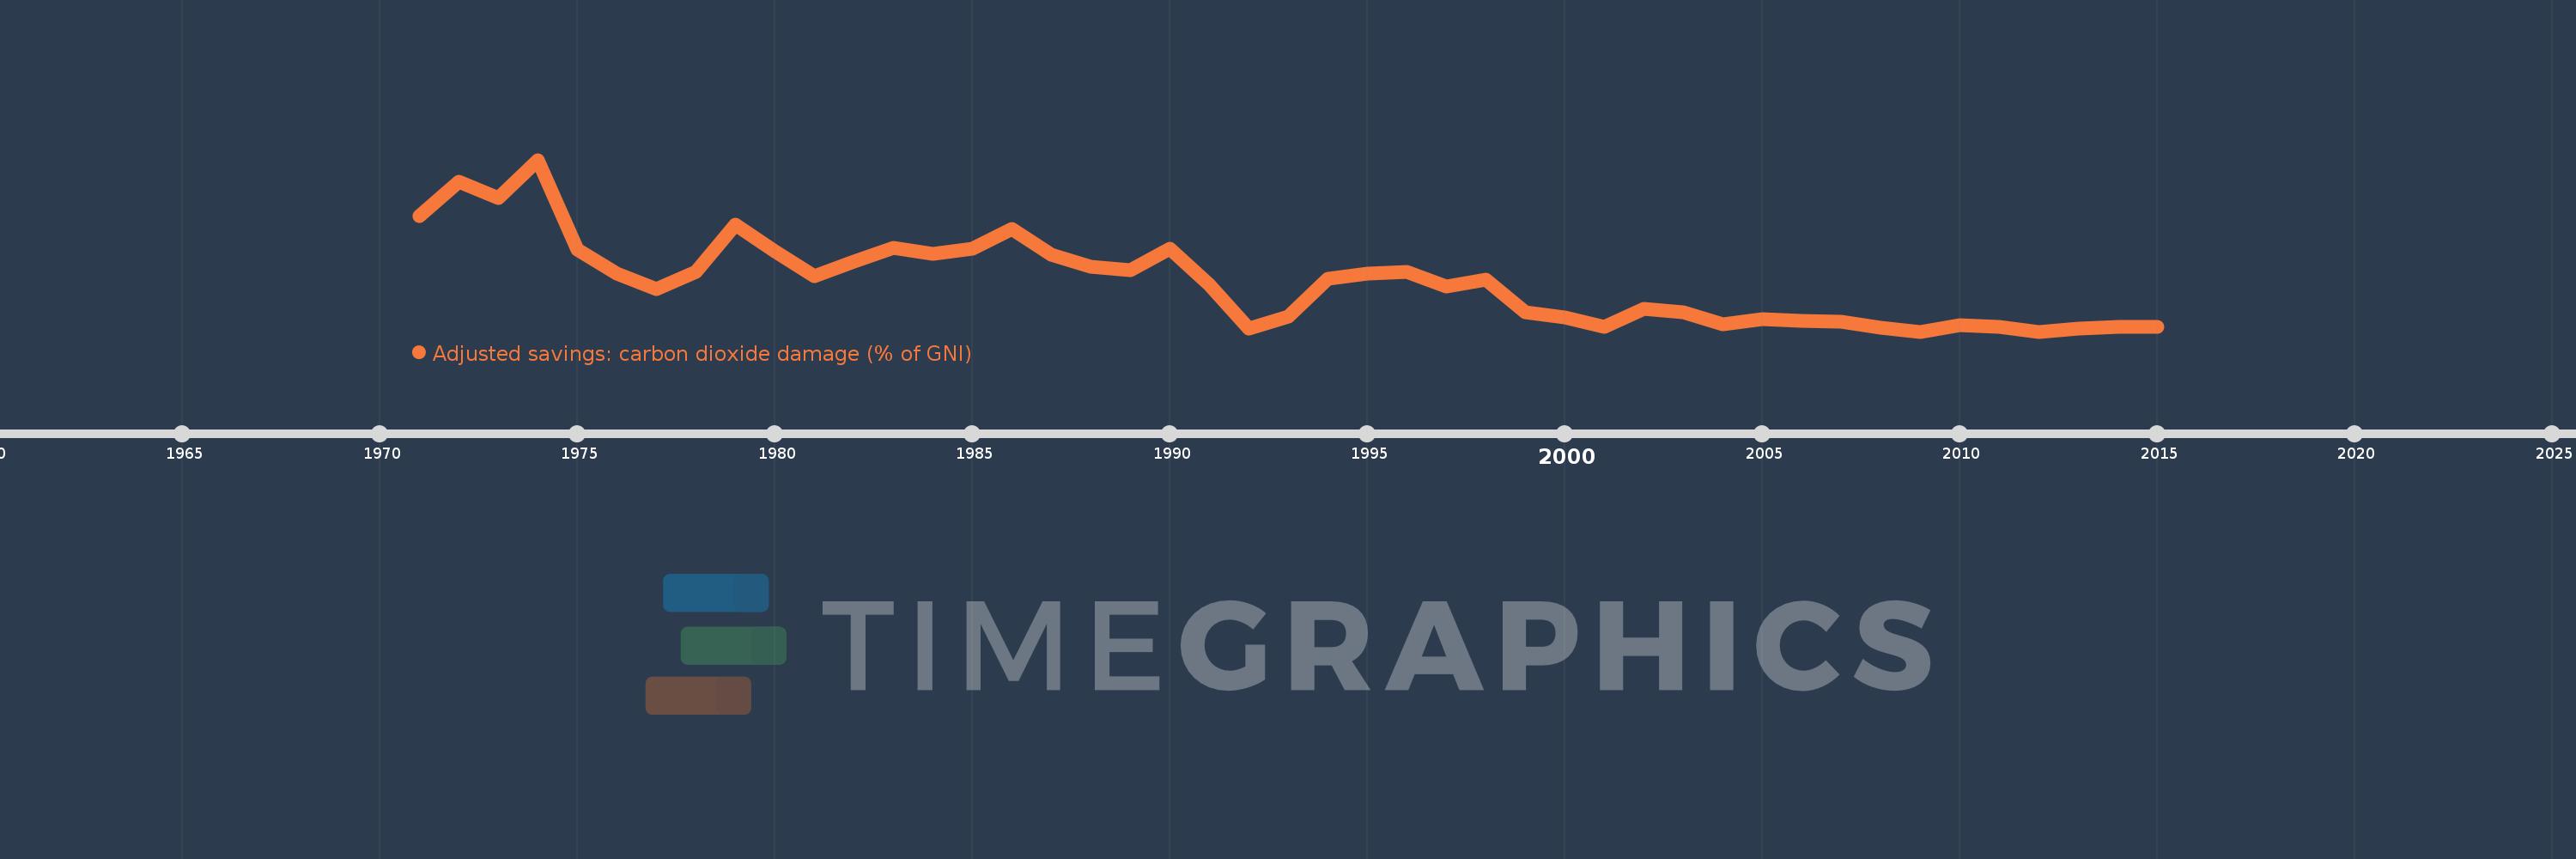
Adjusted savings: carbon dioxide damage (% of GNI)
2015,2014,2013,2012,2011,2010,2009,2008,2007,2006,2005,2004,2003,2002,2001,2000,1999,1998,1997,1996,1995,1994,1993,1992,1991,1990,1989,1988,1987,1986,1985,1984,1983,1982,1981,1980,1979,1978,1977,1976,1975,1974,1973,1972,1971
This statistics in other country:
AfghanistanAlbaniaAlgeriaAndorraAngolaAntigua and BarbudaArab WorldArgentinaArmeniaAustraliaAustriaAzerbaijanBahamas, TheBahrainBangladeshBarbadosBelarusBelgiumBelizeBeninBermudaBhutanBoliviaBosnia and HerzegovinaBotswanaBrazilBrunei DarussalamBulgariaBurkina FasoBurundiCabo VerdeCambodiaCameroonCanadaCaribbean small statesCentral African RepublicCentral Europe and the BalticsChadChileChinaColombiaComorosCongo, Dem. Rep.Congo, Rep.Costa RicaCote d'IvoireCroatiaCubaCyprusCzech RepublicDenmarkDjiboutiDominicaDominican RepublicEarly-demographic dividendEast Asia & PacificEast Asia & Pacific (excluding high income)East Asia & Pacific (IDA & IBRD countries)EcuadorEgypt, Arab Rep.El SalvadorEquatorial GuineaEritreaEstoniaEthiopiaEuro areaEurope & Central AsiaEurope & Central Asia (excluding high income)Europe & Central Asia (IDA & IBRD countries)European UnionFaroe IslandsFijiFinlandFragile and conflict affected situationsFranceFrench PolynesiaGabonGambia, TheGeorgiaGermanyGhanaGreeceGreenlandGrenadaGuatemalaGuineaGuinea-BissauGuyanaHaitiHeavily indebted poor countries (HIPC)High incomeHondurasHong Kong SAR, ChinaHungaryIBRD onlyIcelandIDA & IBRD totalIDA blendIDA onlyIDA totalIndiaIndonesiaIran, Islamic Rep.IraqIrelandIsraelItalyJamaicaJapanJordanKazakhstanKenyaKiribatiKorea, Rep.KuwaitKyrgyz RepublicLao PDRLate-demographic dividendLatin America & Caribbean Latin America & Caribbean (excluding high income)Latin America & the Caribbean (IDA & IBRD countries)LatviaLeast developed countries: UN classificationLebanonLesothoLiberiaLibyaLiechtensteinLithuaniaLow & middle incomeLow incomeLower middle incomeLuxembourgMacao SAR, ChinaMacedonia, FYRMadagascarMalawiMalaysiaMaldivesMaliMaltaMarshall IslandsMauritaniaMauritiusMexicoMicronesia, Fed. Sts.Middle East & North AfricaMiddle East & North Africa (excluding high income)Middle East & North Africa (IDA & IBRD countries)Middle incomeMoldovaMongoliaMontenegroMoroccoMozambiqueNamibiaNepalNetherlandsNew CaledoniaNew ZealandNicaraguaNigerNigeriaNorth AmericaNorwayOECD membersOmanOther small statesPacific island small statesPakistanPalauPanamaPapua New GuineaParaguayPeruPhilippinesPolandPortugalPost-demographic dividendPre-demographic dividendQatarRomaniaRussian FederationRwandaSamoaSao Tome and PrincipeSaudi ArabiaSenegalSerbiaSeychellesSierra LeoneSingaporeSlovak RepublicSloveniaSmall statesSolomon IslandsSouth AfricaSouth AsiaSouth Asia (IDA & IBRD)SpainSri LankaSt. Kitts and NevisSt. LuciaSt. Vincent and the GrenadinesSub-Saharan Africa Sub-Saharan Africa (excluding high income)Sub-Saharan Africa (IDA & IBRD countries)SudanSurinameSwazilandSwedenSwitzerlandSyrian Arab RepublicTajikistanTanzaniaThailandTimor-LesteTogoTongaTrinidad and TobagoTunisiaTurkeyTurkmenistanUgandaUkraineUnited Arab EmiratesUnited KingdomUnited StatesUpper middle incomeUruguayUzbekistanVanuatuVenezuela, RBVietnamWest Bank and GazaWorldYemen, Rep.ZambiaZimbabwe Timeline:
This timeline shows a graph from 1971 to 2015 of Gabon. No data until 1970. Number of actual observations by date: 45.
Source name:
World Development Indicators
Source organization:
World Bank staff estimates based on Samuel Fankhauser's "Valuing Climate Change: The Economics of the Greenhouse" (1995).
Categories, topics:
Economy & Growth, Environment
Last updated:
apr 23, 2017
Indicators value changes by year
At the date of observation
Value
Absolute change
Change from previous value
jan 1, 1971
0.905
+0.905
0.0%
jan 1, 1972
1.129
+0.224
24.72%
jan 1, 1973
1.021
-0.108
-9.57%
jan 1, 1974
1.276
+0.255
25.01%
jan 1, 1975
0.678
-0.599
-46.9%
jan 1, 1976
0.522
-0.156
-23.02%
jan 1, 1977
0.419
-0.102
-19.62%
jan 1, 1978
0.531
+0.111
26.56%
jan 1, 1979
0.846
+0.315
59.36%
jan 1, 1980
0.67
-0.175
-20.71%
jan 1, 1981
0.503
-0.168
-25.03%
jan 1, 1982
0.601
+0.099
19.62%
jan 1, 1983
0.689
+0.088
14.59%
jan 1, 1984
0.651
-0.038
-5.51%
jan 1, 1985
0.687
+0.036
5.59%
jan 1, 1986
0.815
+0.128
18.6%
jan 1, 1987
0.649
-0.166
-20.39%
jan 1, 1988
0.566
-0.083
-12.73%
jan 1, 1989
0.546
-0.02
-3.6%
jan 1, 1990
0.688
+0.142
25.97%
jan 1, 1991
0.449
-0.239
-34.79%
jan 1, 1992
0.157
-0.291
-64.9%
jan 1, 1993
0.234
+0.077
48.72%
jan 1, 1994
0.485
+0.251
107.23%
jan 1, 1995
0.519
+0.034
7.03%
jan 1, 1996
0.531
+0.012
2.25%
jan 1, 1997
0.436
-0.095
-17.8%
jan 1, 1998
0.482
+0.045
10.41%
jan 1, 1999
0.263
-0.218
-45.32%
jan 1, 2000
0.231
-0.032
-12.29%
jan 1, 2001
0.167
-0.064
-27.69%
jan 1, 2002
0.286
+0.119
71.22%
jan 1, 2003
0.267
-0.02
-6.86%
jan 1, 2004
0.186
-0.08
-30.15%
jan 1, 2005
0.219
+0.033
17.69%
jan 1, 2006
0.207
-0.012
-5.36%
jan 1, 2007
0.2
-0.007
-3.56%
jan 1, 2008
0.162
-0.038
-19.05%
jan 1, 2009
0.136
-0.026
-16.04%
jan 1, 2010
0.177
+0.041
30.16%
jan 1, 2011
0.167
-0.01
-5.81%
jan 1, 2012
0.136
-0.031
-18.45%
jan 1, 2013
0.158
+0.022
16.33%
jan 1, 2014
0.166
+0.008
5.01%
jan 1, 2015
0.169
+0.003
1.81%
Ranking of countries by current statistics by years


Comments: