29
/
en
AIzaSyAYiBZKx7MnpbEhh9jyipgxe19OcubqV5w
April 1, 2024
109265
Congo, Dem. Rep.
COD
true
2
1
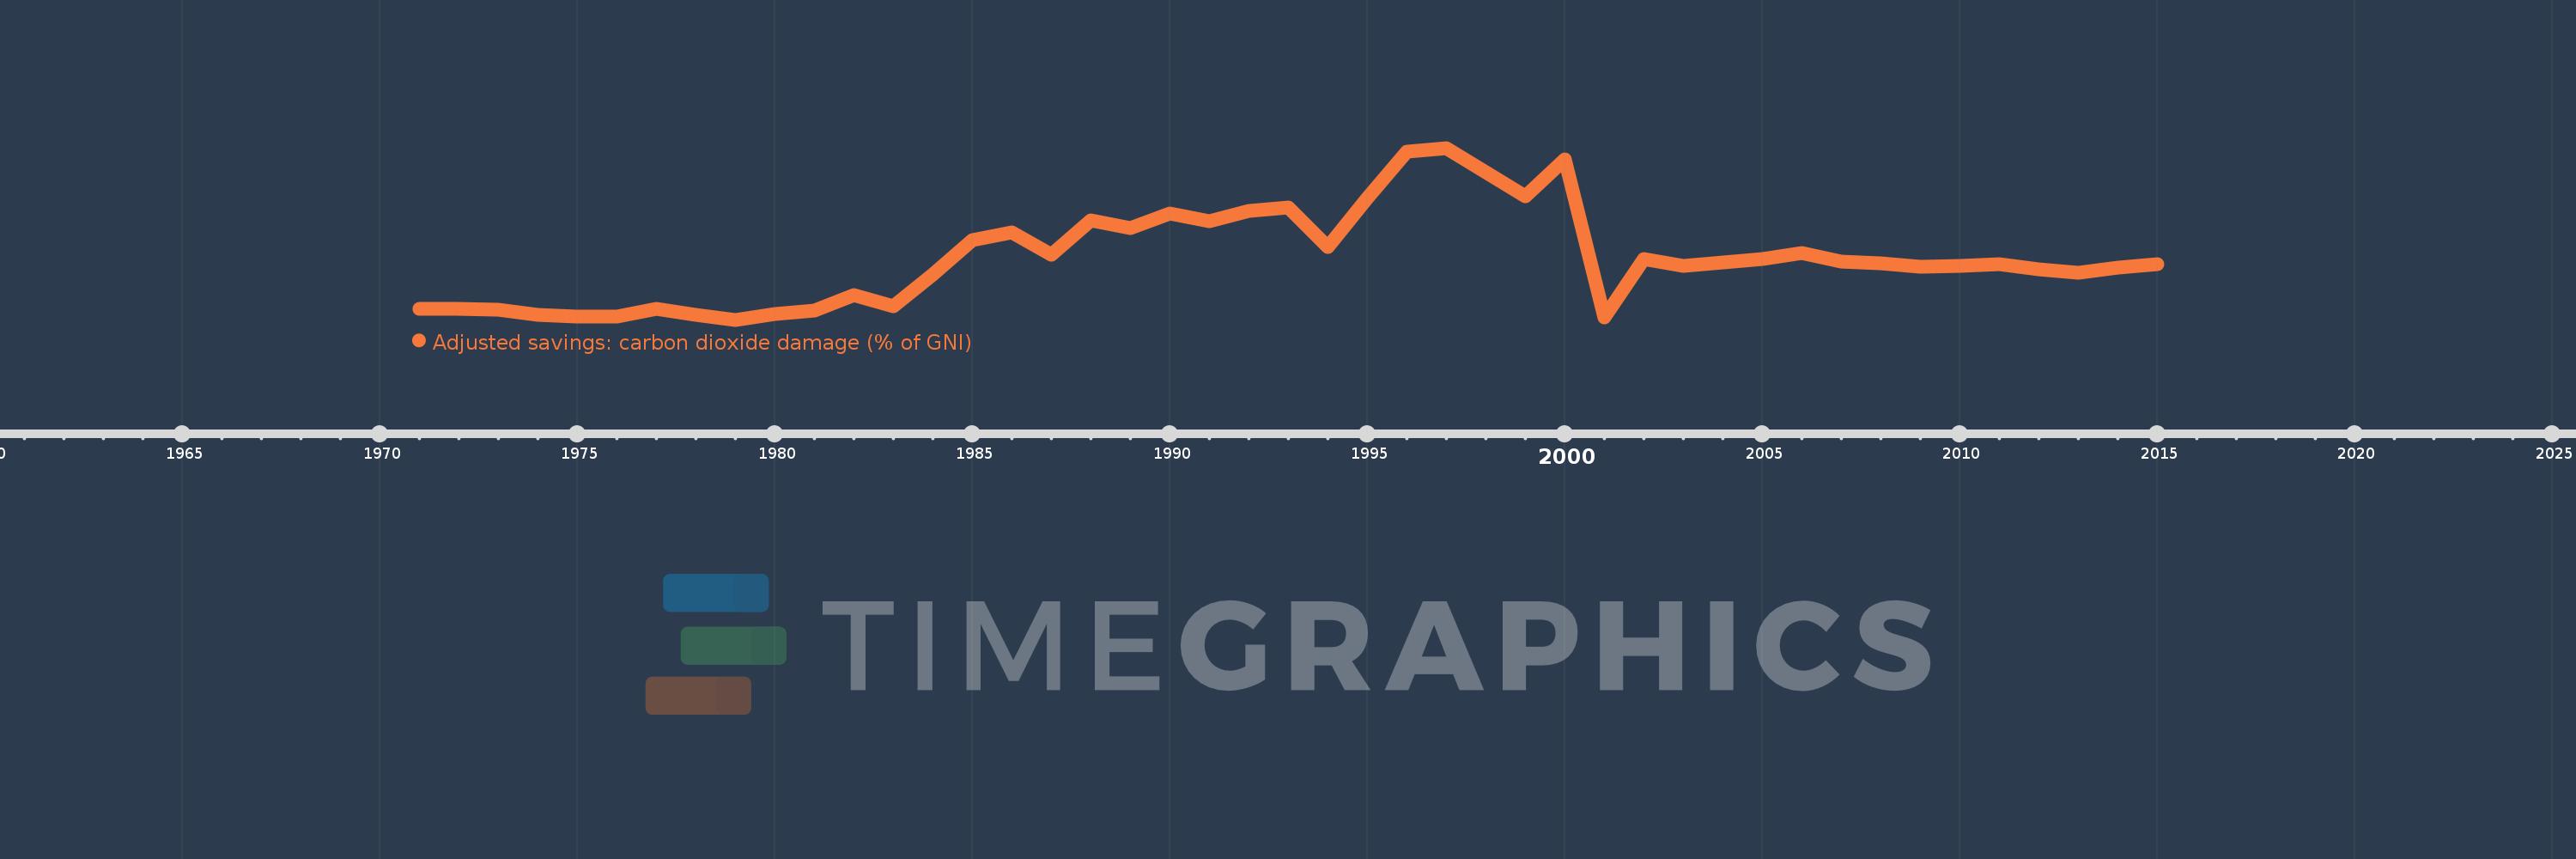
Adjusted savings: carbon dioxide damage (% of GNI)
2015,2014,2013,2012,2011,2010,2009,2008,2007,2006,2005,2004,2003,2002,2001,2000,1999,1998,1997,1996,1995,1994,1993,1992,1991,1990,1989,1988,1987,1986,1985,1984,1983,1982,1981,1980,1979,1978,1977,1976,1975,1974,1973,1972,1971
This statistics in other country:
AfghanistanAlbaniaAlgeriaAndorraAngolaAntigua and BarbudaArab WorldArgentinaArmeniaAustraliaAustriaAzerbaijanBahamas, TheBahrainBangladeshBarbadosBelarusBelgiumBelizeBeninBermudaBhutanBoliviaBosnia and HerzegovinaBotswanaBrazilBrunei DarussalamBulgariaBurkina FasoBurundiCabo VerdeCambodiaCameroonCanadaCaribbean small statesCentral African RepublicCentral Europe and the BalticsChadChileChinaColombiaComorosCongo, Dem. Rep.Congo, Rep.Costa RicaCote d'IvoireCroatiaCubaCyprusCzech RepublicDenmarkDjiboutiDominicaDominican RepublicEarly-demographic dividendEast Asia & PacificEast Asia & Pacific (excluding high income)East Asia & Pacific (IDA & IBRD countries)EcuadorEgypt, Arab Rep.El SalvadorEquatorial GuineaEritreaEstoniaEthiopiaEuro areaEurope & Central AsiaEurope & Central Asia (excluding high income)Europe & Central Asia (IDA & IBRD countries)European UnionFaroe IslandsFijiFinlandFragile and conflict affected situationsFranceFrench PolynesiaGabonGambia, TheGeorgiaGermanyGhanaGreeceGreenlandGrenadaGuatemalaGuineaGuinea-BissauGuyanaHaitiHeavily indebted poor countries (HIPC)High incomeHondurasHong Kong SAR, ChinaHungaryIBRD onlyIcelandIDA & IBRD totalIDA blendIDA onlyIDA totalIndiaIndonesiaIran, Islamic Rep.IraqIrelandIsraelItalyJamaicaJapanJordanKazakhstanKenyaKiribatiKorea, Rep.KuwaitKyrgyz RepublicLao PDRLate-demographic dividendLatin America & Caribbean Latin America & Caribbean (excluding high income)Latin America & the Caribbean (IDA & IBRD countries)LatviaLeast developed countries: UN classificationLebanonLesothoLiberiaLibyaLiechtensteinLithuaniaLow & middle incomeLow incomeLower middle incomeLuxembourgMacao SAR, ChinaMacedonia, FYRMadagascarMalawiMalaysiaMaldivesMaliMaltaMarshall IslandsMauritaniaMauritiusMexicoMicronesia, Fed. Sts.Middle East & North AfricaMiddle East & North Africa (excluding high income)Middle East & North Africa (IDA & IBRD countries)Middle incomeMoldovaMongoliaMontenegroMoroccoMozambiqueNamibiaNepalNetherlandsNew CaledoniaNew ZealandNicaraguaNigerNigeriaNorth AmericaNorwayOECD membersOmanOther small statesPacific island small statesPakistanPalauPanamaPapua New GuineaParaguayPeruPhilippinesPolandPortugalPost-demographic dividendPre-demographic dividendQatarRomaniaRussian FederationRwandaSamoaSao Tome and PrincipeSaudi ArabiaSenegalSerbiaSeychellesSierra LeoneSingaporeSlovak RepublicSloveniaSmall statesSolomon IslandsSouth AfricaSouth AsiaSouth Asia (IDA & IBRD)SpainSri LankaSt. Kitts and NevisSt. LuciaSt. Vincent and the GrenadinesSub-Saharan Africa Sub-Saharan Africa (excluding high income)Sub-Saharan Africa (IDA & IBRD countries)SudanSurinameSwazilandSwedenSwitzerlandSyrian Arab RepublicTajikistanTanzaniaThailandTimor-LesteTogoTongaTrinidad and TobagoTunisiaTurkeyTurkmenistanUgandaUkraineUnited Arab EmiratesUnited KingdomUnited StatesUpper middle incomeUruguayUzbekistanVanuatuVenezuela, RBVietnamWest Bank and GazaWorldYemen, Rep.ZambiaZimbabwe Timeline:
This timeline shows a graph from 1971 to 2015 of Congo, Dem. Rep.. No data until 1970. Number of actual observations by date: 45.
Source name:
World Development Indicators
Source organization:
World Bank staff estimates based on Samuel Fankhauser's "Valuing Climate Change: The Economics of the Greenhouse" (1995).
Categories, topics:
Economy & Growth, Environment
Last updated:
apr 23, 2017
Indicators value changes by year
At the date of observation
Value
Absolute change
Change from previous value
jan 1, 1971
0.075
+0.075
0.0%
jan 1, 1972
0.075
+0.001
1.2%
jan 1, 1973
0.074
-0.002
-2.6%
jan 1, 1974
0.065
-0.009
-11.62%
jan 1, 1975
0.062
-0.003
-4.58%
jan 1, 1976
0.062
0.0
-0.11%
jan 1, 1977
0.075
+0.013
20.57%
jan 1, 1978
0.065
-0.01
-13.45%
jan 1, 1979
0.056
-0.009
-13.39%
jan 1, 1980
0.067
+0.011
19.03%
jan 1, 1981
0.073
+0.006
8.91%
jan 1, 1982
0.1
+0.028
38.0%
jan 1, 1983
0.081
-0.019
-19.41%
jan 1, 1984
0.138
+0.057
70.45%
jan 1, 1985
0.199
+0.061
44.31%
jan 1, 1986
0.213
+0.015
7.44%
jan 1, 1987
0.174
-0.039
-18.24%
jan 1, 1988
0.235
+0.061
34.81%
jan 1, 1989
0.222
-0.013
-5.55%
jan 1, 1990
0.247
+0.025
11.3%
jan 1, 1991
0.234
-0.013
-5.13%
jan 1, 1992
0.252
+0.017
7.45%
jan 1, 1993
0.259
+0.007
2.63%
jan 1, 1994
0.188
-0.071
-27.47%
jan 1, 1995
0.275
+0.088
46.91%
jan 1, 1996
0.359
+0.084
30.38%
jan 1, 1997
0.366
+0.007
2.0%
jan 1, 1998
0.322
-0.044
-11.98%
jan 1, 1999
0.279
-0.044
-13.57%
jan 1, 2000
0.346
+0.067
23.98%
jan 1, 2001
0.06
-0.286
-82.65%
jan 1, 2002
0.166
+0.106
177.07%
jan 1, 2003
0.153
-0.013
-7.88%
jan 1, 2004
0.16
+0.007
4.39%
jan 1, 2005
0.166
+0.006
4.04%
jan 1, 2006
0.176
+0.01
5.82%
jan 1, 2007
0.161
-0.015
-8.35%
jan 1, 2008
0.158
-0.004
-2.22%
jan 1, 2009
0.151
-0.007
-4.17%
jan 1, 2010
0.153
+0.002
1.34%
jan 1, 2011
0.156
+0.003
1.82%
jan 1, 2012
0.147
-0.009
-5.56%
jan 1, 2013
0.141
-0.006
-3.9%
jan 1, 2014
0.15
+0.008
5.81%
jan 1, 2015
0.157
+0.008
5.06%
Ranking of countries by current statistics by years


Comments: