29
/
en
AIzaSyAYiBZKx7MnpbEhh9jyipgxe19OcubqV5w
April 1, 2024
48865
Middle East & North Africa (excluding high income)
MNA
false
2
1
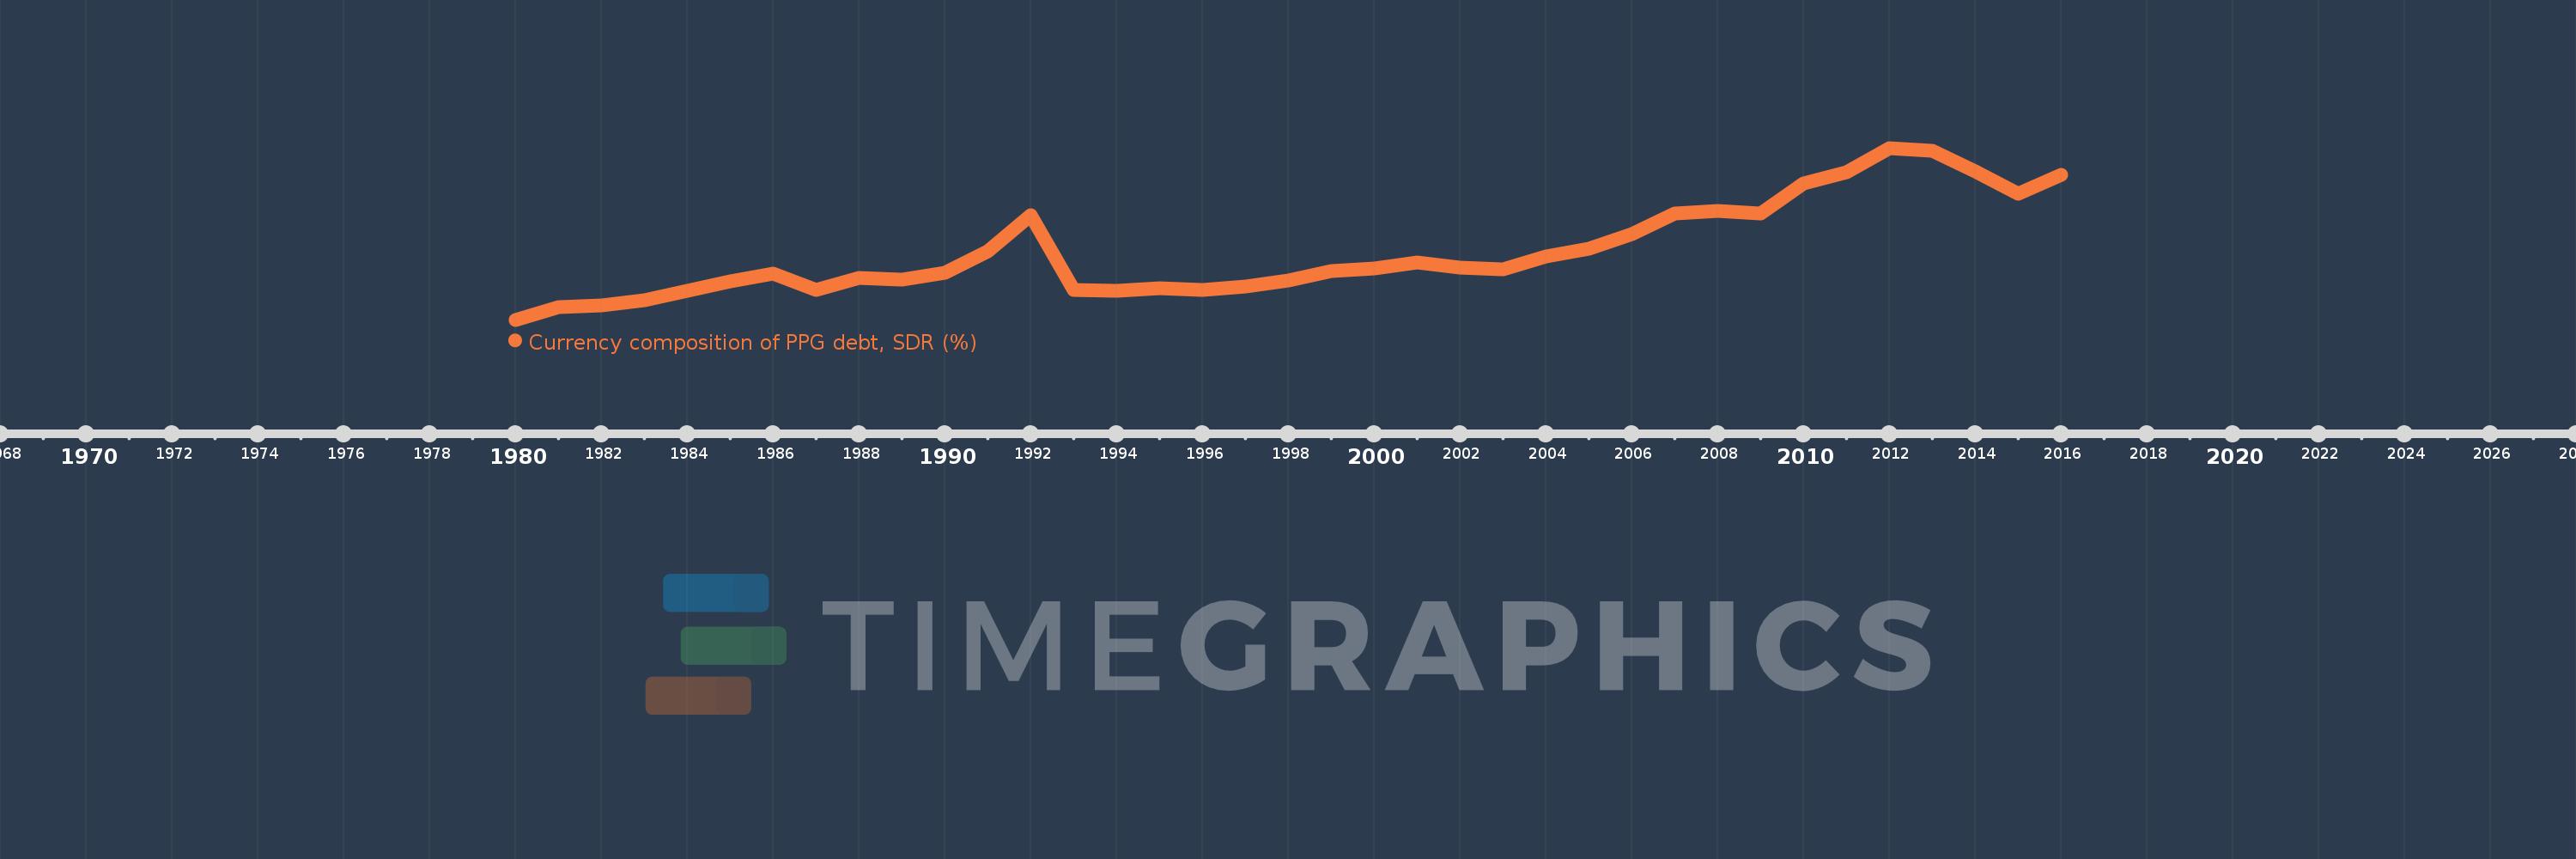
Currency composition of PPG debt, SDR (%)
2016,2015,2014,2013,2012,2011,2010,2009,2008,2007,2006,2005,2004,2003,2002,2001,2000,1999,1998,1997,1996,1995,1994,1993,1992,1991,1990,1989,1988,1987,1986,1985,1984,1983,1982,1981,1980
This statistics in other country:
Timeline:
This timeline shows a graph from 1980 to 2016 of Middle East & North Africa (excluding high income). No data until 1979. Number of actual observations by date: 37.
Source name:
World Development Indicators
Source organization:
World Bank, International Debt Statistics.
Categories, topics:
External Debt
Last updated:
apr 23, 2017
Indicators value changes by year
At the date of observation
Value
Absolute change
Change from previous value
jan 1, 1981
0.108
+0.108
%
jan 1, 1982
0.119
+0.011
9.99%
jan 1, 1983
0.165
+0.046
38.35%
jan 1, 1984
0.24
+0.075
45.53%
jan 1, 1985
0.32
+0.08
33.42%
jan 1, 1986
0.387
+0.067
20.9%
jan 1, 1987
0.25
-0.137
-35.32%
jan 1, 1988
0.351
+0.1
40.07%
jan 1, 1989
0.334
-0.017
-4.8%
jan 1, 1990
0.395
+0.061
18.34%
jan 1, 1991
0.572
+0.176
44.62%
jan 1, 1992
0.876
+0.304
53.21%
jan 1, 1993
0.251
-0.625
-71.34%
jan 1, 1994
0.244
-0.007
-2.65%
jan 1, 1995
0.266
+0.021
8.76%
jan 1, 1996
0.251
-0.015
-5.61%
jan 1, 1997
0.275
+0.024
9.56%
jan 1, 1998
0.329
+0.054
19.66%
jan 1, 1999
0.408
+0.079
24.01%
jan 1, 2000
0.428
+0.02
5.0%
jan 1, 2001
0.476
+0.048
11.27%
jan 1, 2002
0.435
-0.042
-8.77%
jan 1, 2003
0.423
-0.012
-2.77%
jan 1, 2004
0.532
+0.11
25.94%
jan 1, 2005
0.594
+0.062
11.59%
jan 1, 2006
0.718
+0.125
20.97%
jan 1, 2007
0.888
+0.169
23.57%
jan 1, 2008
0.911
+0.023
2.6%
jan 1, 2009
0.89
-0.021
-2.26%
jan 1, 2010
1.136
+0.246
27.63%
jan 1, 2011
1.232
+0.096
8.43%
jan 1, 2012
1.436
+0.204
16.52%
jan 1, 2013
1.414
-0.021
-1.49%
jan 1, 2014
1.239
-0.175
-12.36%
jan 1, 2015
1.053
-0.187
-15.08%
jan 1, 2016
1.208
+0.156
14.79%
Ranking of countries by current statistics by years


Comments: