29
/
en
AIzaSyAYiBZKx7MnpbEhh9jyipgxe19OcubqV5w
April 1, 2024
282103
Vietnam
VNM
true
2
1
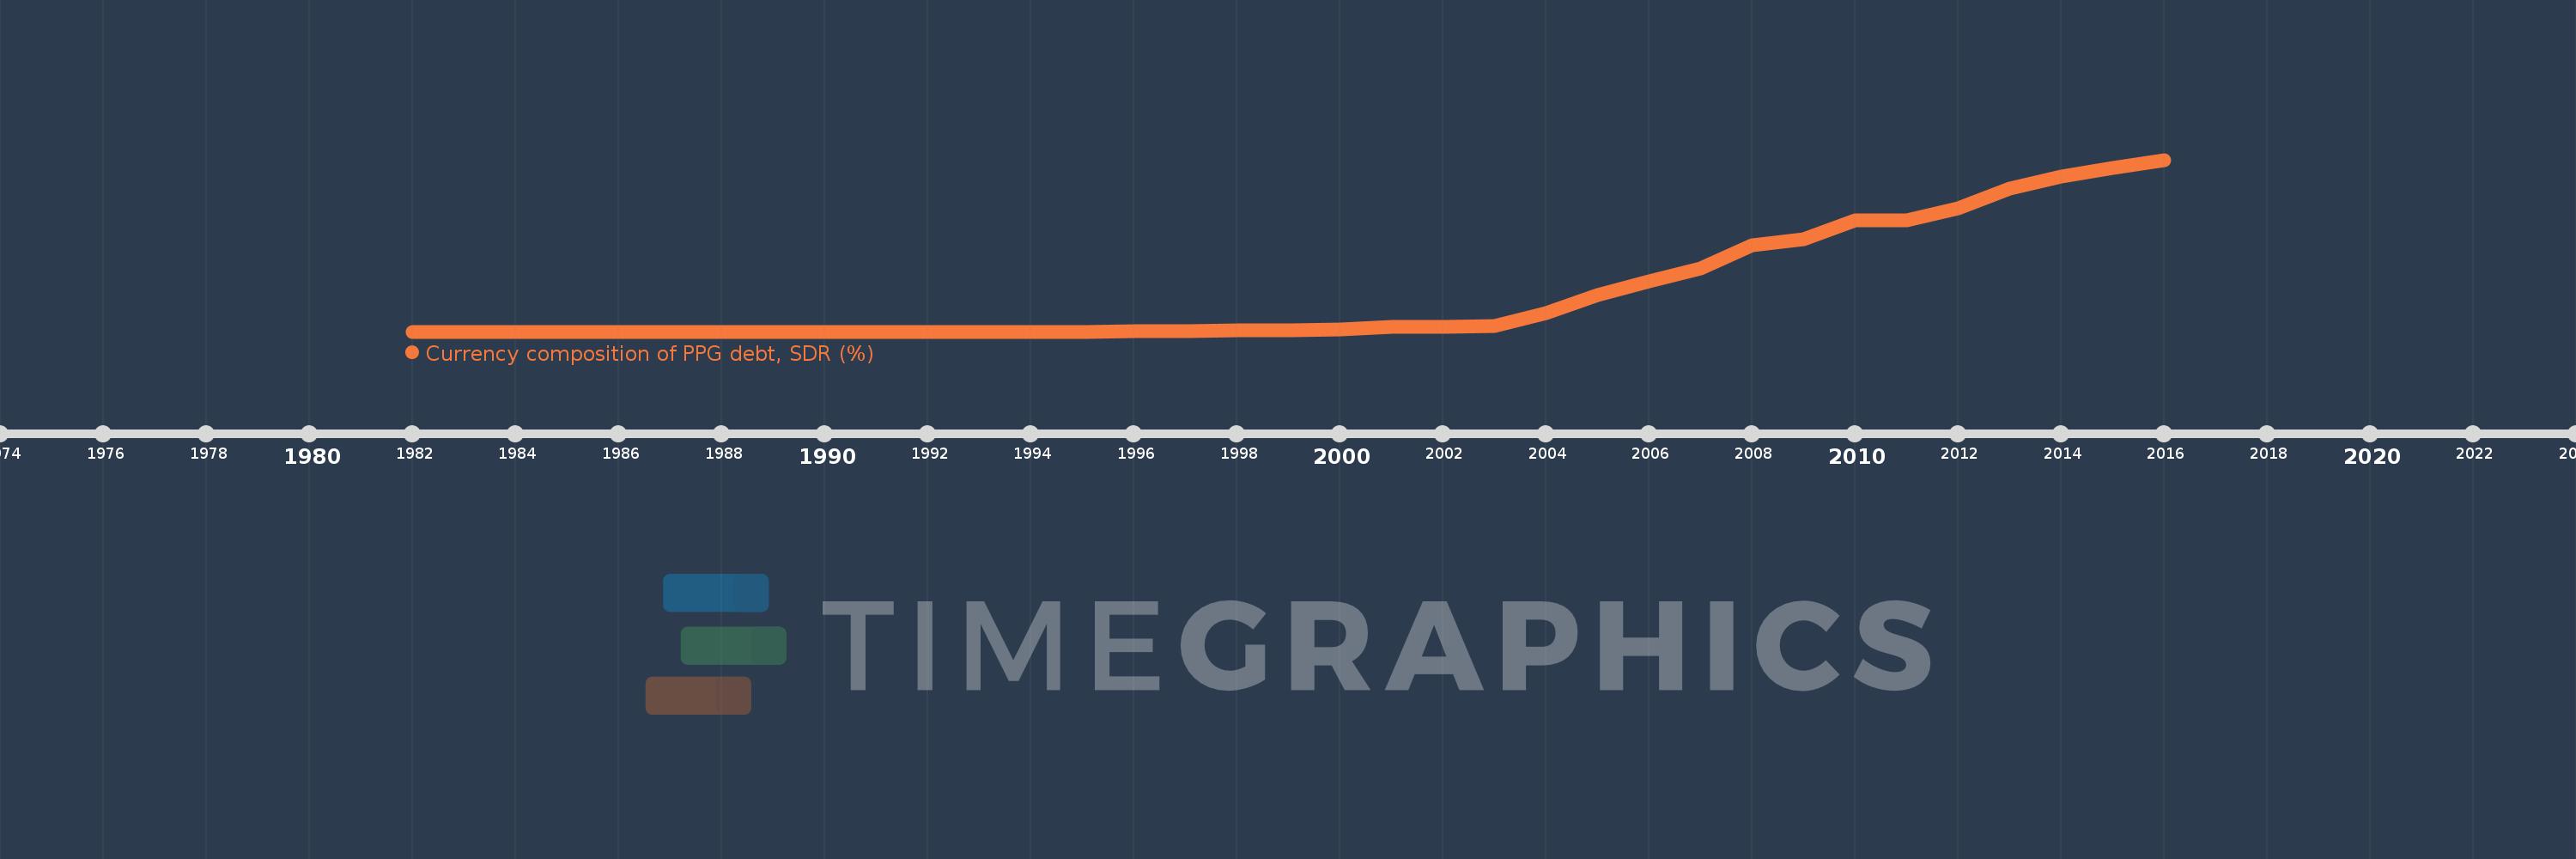
Currency composition of PPG debt, SDR (%)
2016,2015,2014,2013,2012,2011,2010,2009,2008,2007,2006,2005,2004,2003,2002,2001,2000,1999,1998,1997,1996,1995,1994,1993,1992,1991,1990,1989,1988,1987,1986,1985,1984,1983,1982
This statistics in other country:
Timeline:
This timeline shows a graph from 1982 to 2016 of Vietnam. No data until 1981. Number of actual observations by date: 35.
Source name:
World Development Indicators
Source organization:
World Bank, International Debt Statistics.
Categories, topics:
External Debt
Last updated:
apr 23, 2017
Indicators value changes by year
At the date of observation
Value
Absolute change
Change from previous value
jan 1, 1996
0.021
+0.021
%
jan 1, 1997
0.032
+0.011
51.17%
jan 1, 1998
0.089
+0.057
176.71%
jan 1, 1999
0.112
+0.023
25.93%
jan 1, 2000
0.159
+0.047
41.62%
jan 1, 2001
0.332
+0.173
108.62%
jan 1, 2002
0.368
+0.036
10.89%
jan 1, 2003
0.402
+0.034
9.36%
jan 1, 2004
1.378
+0.976
242.74%
jan 1, 2005
2.673
+1.295
93.99%
jan 1, 2006
3.735
+1.063
39.75%
jan 1, 2007
4.657
+0.922
24.69%
jan 1, 2008
6.388
+1.731
37.17%
jan 1, 2009
6.814
+0.426
6.66%
jan 1, 2010
8.244
+1.43
20.98%
jan 1, 2011
8.248
+0.005
0.06%
jan 1, 2012
9.129
+0.881
10.68%
jan 1, 2013
10.578
+1.449
15.87%
jan 1, 2014
11.443
+0.865
8.18%
jan 1, 2015
12.089
+0.646
5.65%
jan 1, 2016
12.69
+0.6
4.97%
Ranking of countries by current statistics by years


Comments: