29
/
en
AIzaSyAYiBZKx7MnpbEhh9jyipgxe19OcubqV5w
April 1, 2024
273382
Ukraine
UKR
true
2
1
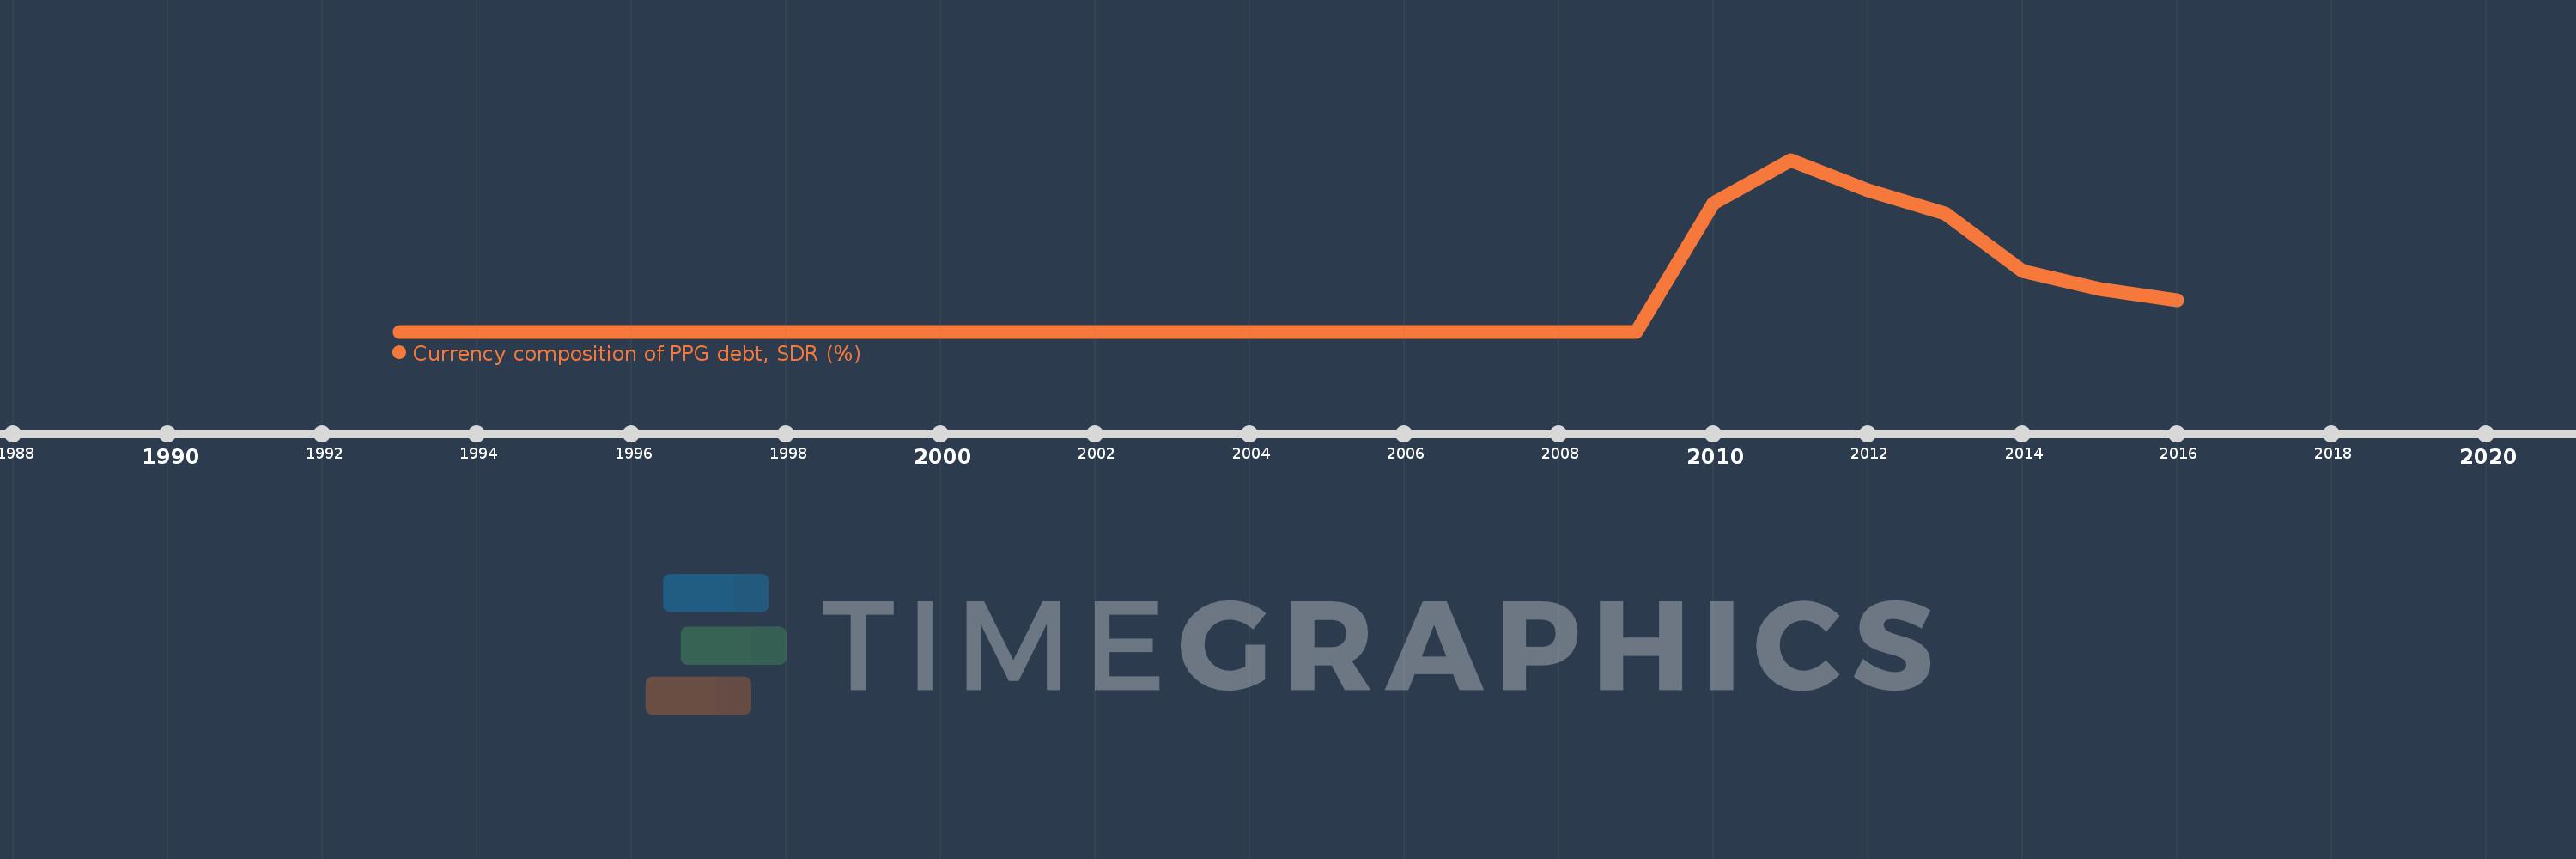
Currency composition of PPG debt, SDR (%)
2016,2015,2014,2013,2012,2011,2010,2009,2008,2007,2006,2005,2004,2003,2002,2001,2000,1999,1998,1997,1996,1995,1994,1993
This statistics in other country:
Timeline:
This timeline shows a graph from 1993 to 2016 of Ukraine. No data until 1992. Number of actual observations by date: 24.
Source name:
World Development Indicators
Source organization:
World Bank, International Debt Statistics.
Categories, topics:
External Debt
Last updated:
apr 23, 2017
Indicators value changes by year
Maximum:
34.872
jan 1, 2011
At the date of observation
Value
Absolute change
Change from previous value
jan 1, 2010
26.102
+26.102
%
jan 1, 2011
34.872
+8.771
33.6%
jan 1, 2012
28.704
-6.168
-17.69%
jan 1, 2013
24.018
-4.686
-16.33%
jan 1, 2014
12.302
-11.716
-48.78%
jan 1, 2015
8.649
-3.653
-29.69%
jan 1, 2016
6.305
-2.344
-27.1%
Ranking of countries by current statistics by years


Comments: