29
/
en
AIzaSyAYiBZKx7MnpbEhh9jyipgxe19OcubqV5w
April 1, 2024
27997
East Asia & Pacific (excluding high income)
EAP
false
2
1
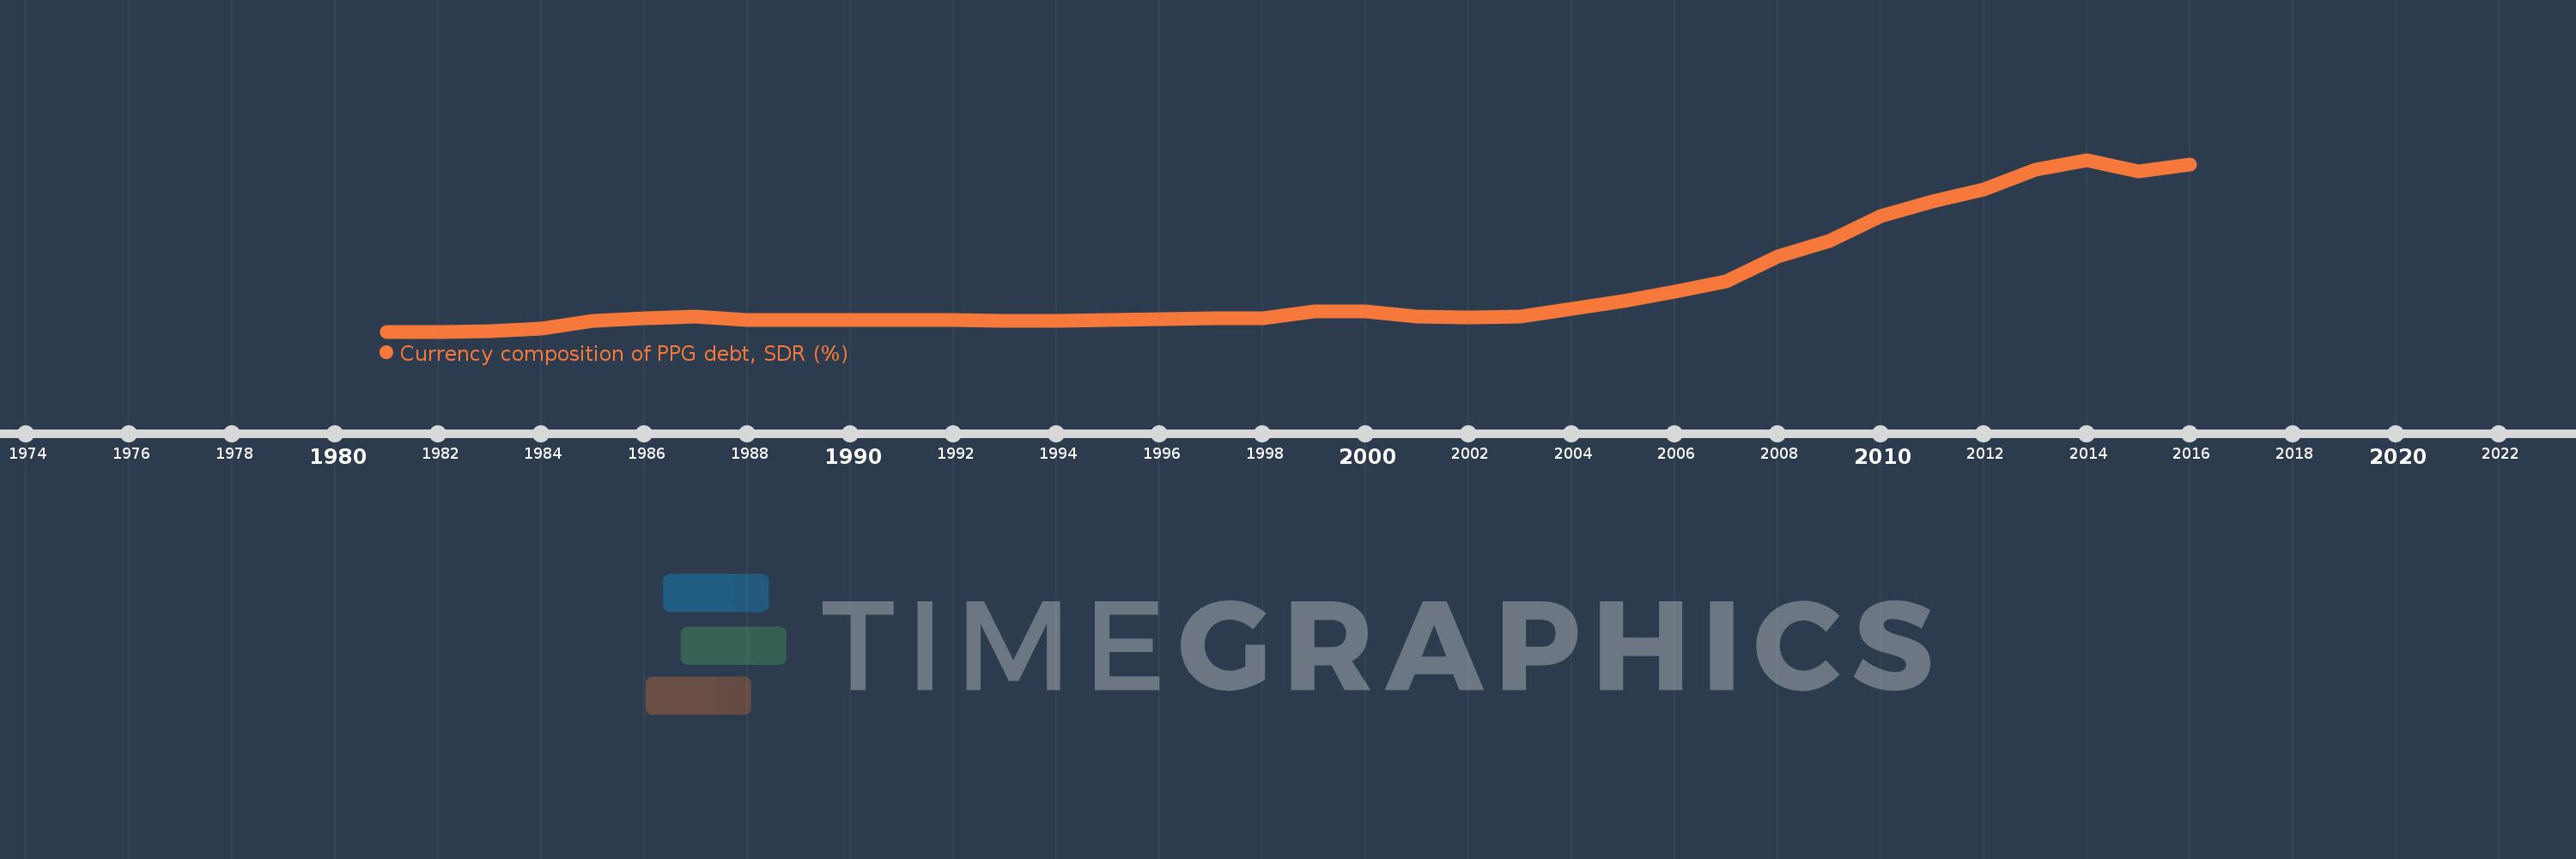
Currency composition of PPG debt, SDR (%)
2016,2015,2014,2013,2012,2011,2010,2009,2008,2007,2006,2005,2004,2003,2002,2001,2000,1999,1998,1997,1996,1995,1994,1993,1992,1991,1990,1989,1988,1987,1986,1985,1984,1983,1982,1981
This statistics in other country:
Timeline:
This timeline shows a graph from 1981 to 2016 of East Asia & Pacific (excluding high income). No data until 1980. Number of actual observations by date: 36.
Source name:
World Development Indicators
Source organization:
World Bank, International Debt Statistics.
Categories, topics:
External Debt
Last updated:
apr 23, 2017
Indicators value changes by year
At the date of observation
Value
Absolute change
Change from previous value
jan 1, 1983
0.008
+0.008
%
jan 1, 1984
0.042
+0.034
440.51%
jan 1, 1985
0.132
+0.09
213.95%
jan 1, 1986
0.172
+0.04
30.44%
jan 1, 1987
0.187
+0.014
8.18%
jan 1, 1988
0.147
-0.039
-20.99%
jan 1, 1989
0.147
-0.001
-0.51%
jan 1, 1990
0.148
+0.002
1.11%
jan 1, 1991
0.151
+0.003
1.87%
jan 1, 1992
0.145
-0.006
-4.25%
jan 1, 1993
0.138
-0.006
-4.26%
jan 1, 1994
0.132
-0.007
-5.0%
jan 1, 1995
0.145
+0.014
10.42%
jan 1, 1996
0.164
+0.019
12.78%
jan 1, 1997
0.174
+0.01
6.19%
jan 1, 1998
0.173
-0.001
-0.5%
jan 1, 1999
0.252
+0.079
45.84%
jan 1, 2000
0.255
+0.003
1.06%
jan 1, 2001
0.187
-0.068
-26.81%
jan 1, 2002
0.181
-0.006
-3.27%
jan 1, 2003
0.192
+0.011
6.22%
jan 1, 2004
0.293
+0.101
52.47%
jan 1, 2005
0.386
+0.094
32.07%
jan 1, 2006
0.514
+0.128
33.01%
jan 1, 2007
0.645
+0.131
25.52%
jan 1, 2008
0.957
+0.312
48.38%
jan 1, 2009
1.155
+0.198
20.71%
jan 1, 2010
1.476
+0.321
27.76%
jan 1, 2011
1.66
+0.184
12.47%
jan 1, 2012
1.812
+0.152
9.13%
jan 1, 2013
2.064
+0.252
13.92%
jan 1, 2014
2.191
+0.127
6.15%
jan 1, 2015
2.047
-0.143
-6.55%
jan 1, 2016
2.132
+0.084
4.12%
Ranking of countries by current statistics by years


Comments: