29
/
en
AIzaSyAYiBZKx7MnpbEhh9jyipgxe19OcubqV5w
April 1, 2024
74805
Azerbaijan
AZE
true
2
1
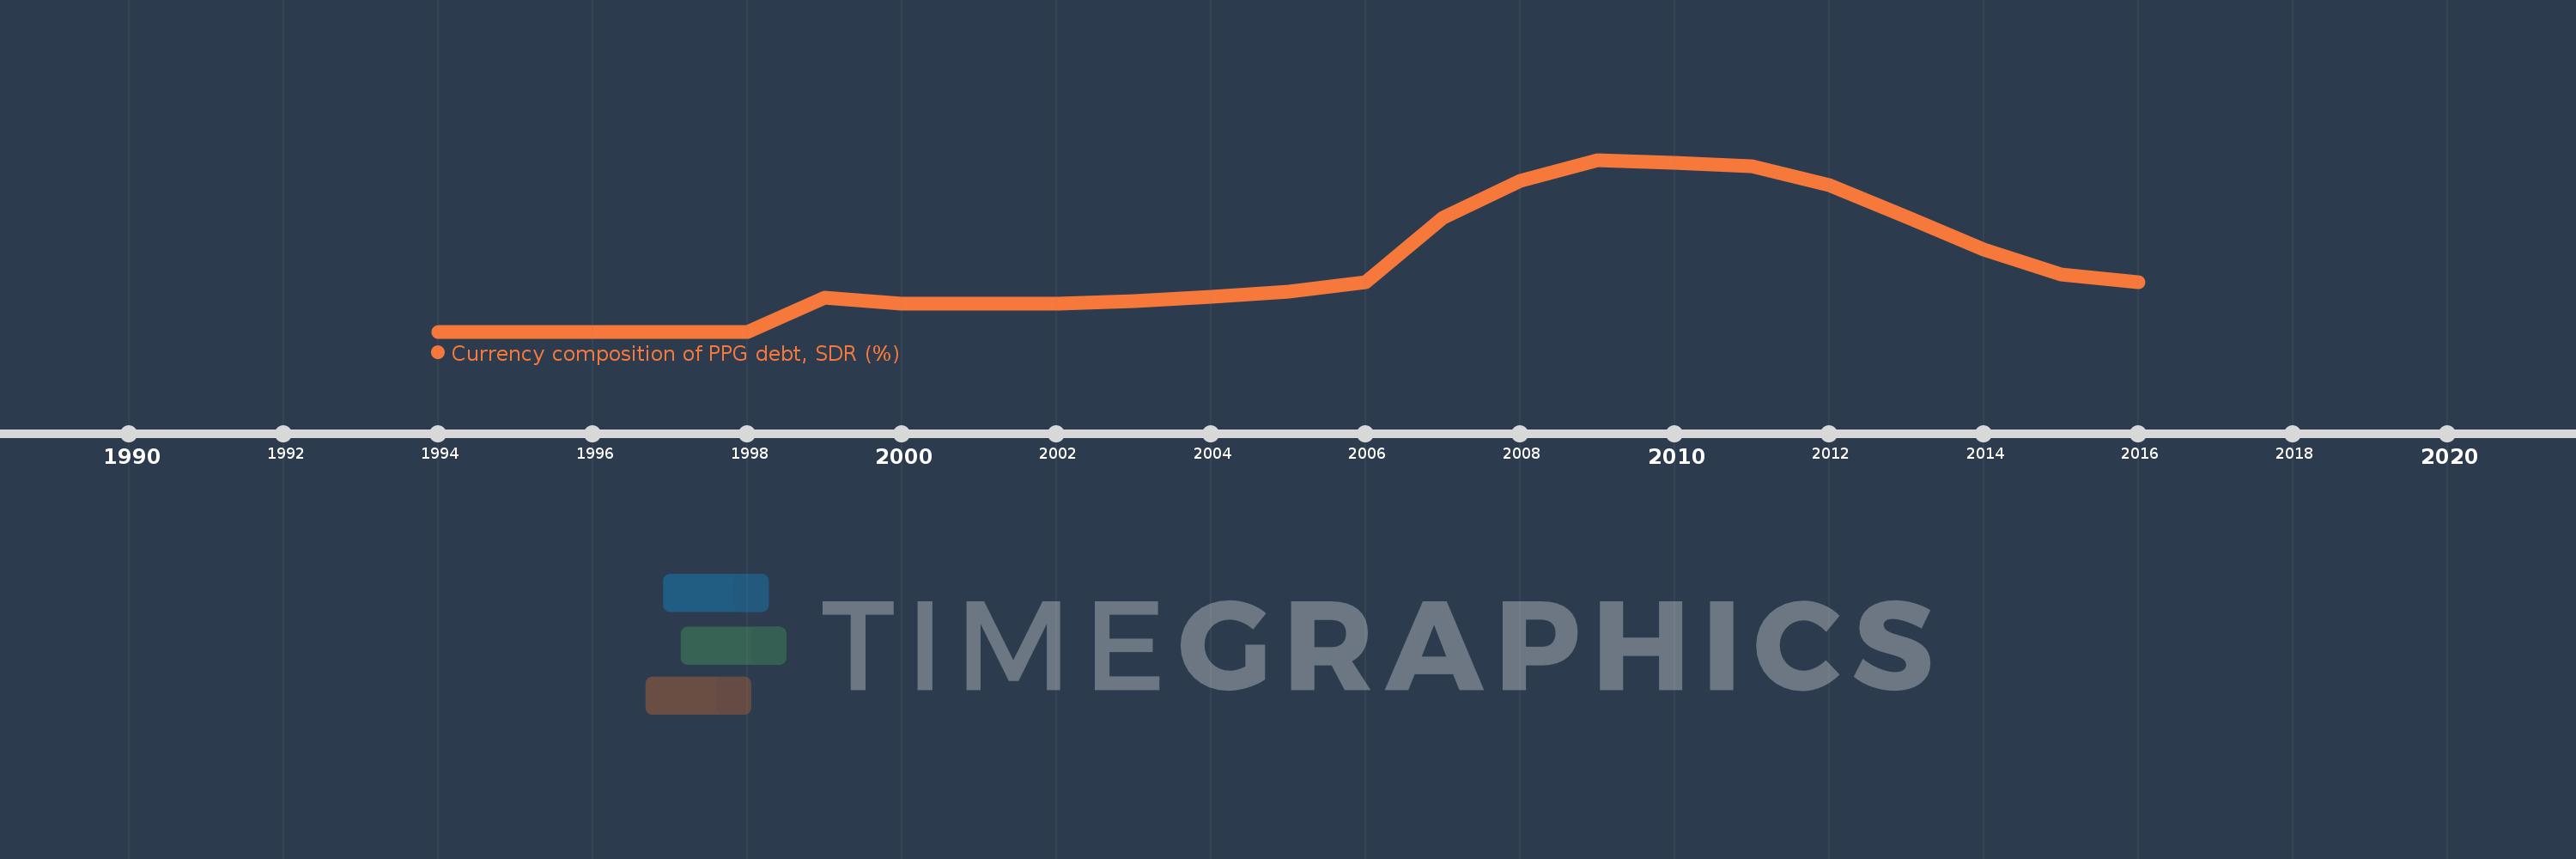
Currency composition of PPG debt, SDR (%)
2016,2015,2014,2013,2012,2011,2010,2009,2008,2007,2006,2005,2004,2003,2002,2001,2000,1999,1998,1997,1996,1995,1994
This statistics in other country:
Timeline:
This timeline shows a graph from 1994 to 2016 of Azerbaijan. No data until 1993. Number of actual observations by date: 23.
Source name:
World Development Indicators
Source organization:
World Bank, International Debt Statistics.
Categories, topics:
External Debt
Last updated:
apr 23, 2017
Indicators value changes by year
At the date of observation
Value
Absolute change
Change from previous value
jan 1, 1999
0.816
+0.816
%
jan 1, 2000
0.672
-0.144
-17.68%
jan 1, 2001
0.67
-0.002
-0.34%
jan 1, 2002
0.675
+0.005
0.78%
jan 1, 2003
0.735
+0.06
8.97%
jan 1, 2004
0.837
+0.102
13.8%
jan 1, 2005
0.958
+0.121
14.44%
jan 1, 2006
1.192
+0.234
24.48%
jan 1, 2007
2.748
+1.556
130.57%
jan 1, 2008
3.639
+0.891
32.41%
jan 1, 2009
4.147
+0.508
13.96%
jan 1, 2010
4.078
-0.069
-1.67%
jan 1, 2011
3.984
-0.094
-2.3%
jan 1, 2012
3.531
-0.453
-11.37%
jan 1, 2013
2.775
-0.756
-21.42%
jan 1, 2014
1.99
-0.785
-28.28%
jan 1, 2015
1.374
-0.616
-30.95%
jan 1, 2016
1.196
-0.179
-13.0%
Ranking of countries by current statistics by years


Comments: