29
/
en
AIzaSyAYiBZKx7MnpbEhh9jyipgxe19OcubqV5w
April 1, 2024
201393
Morocco
MAR
true
2
1
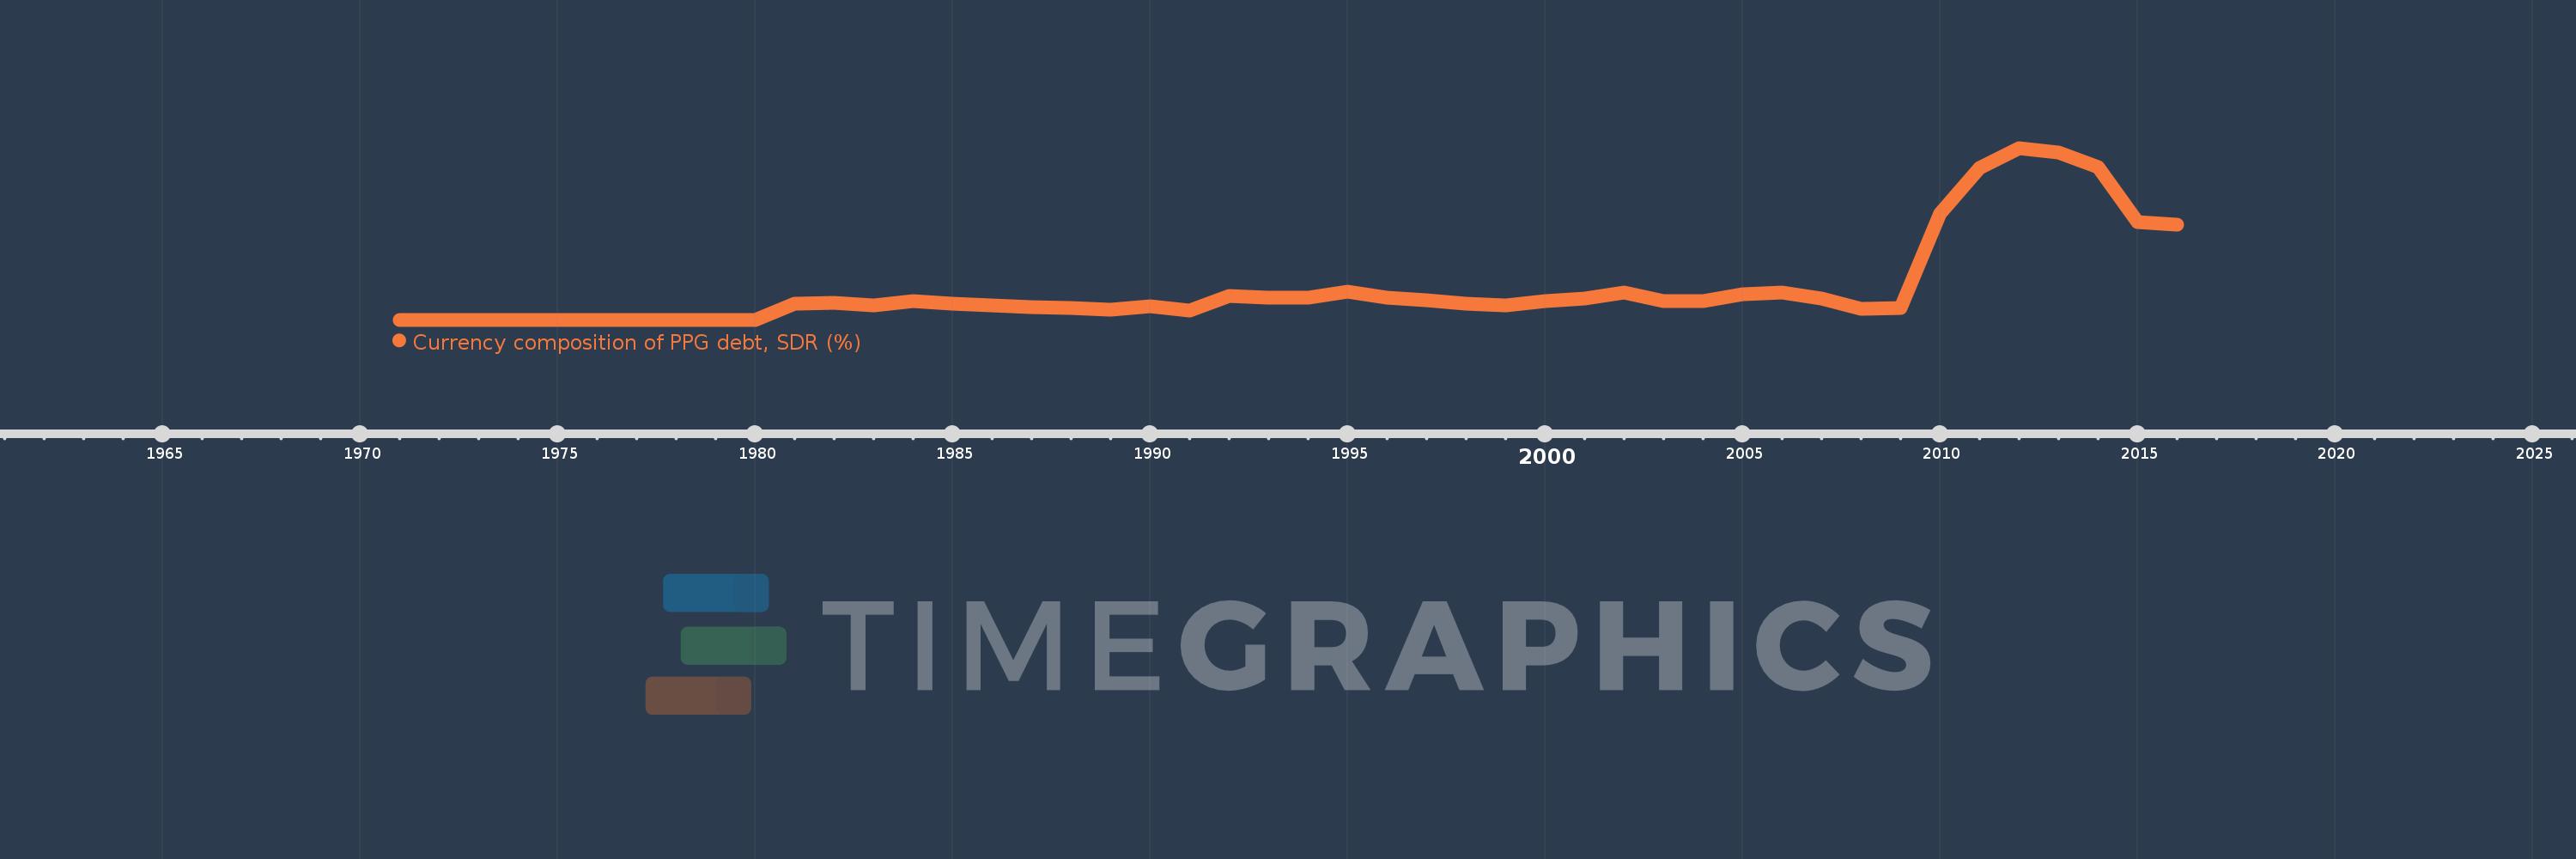
Currency composition of PPG debt, SDR (%)
2016,2015,2014,2013,2012,2011,2010,2009,2008,2007,2006,2005,2004,2003,2002,2001,2000,1999,1998,1997,1996,1995,1994,1993,1992,1991,1990,1989,1988,1987,1986,1985,1984,1983,1982,1981,1980,1979,1978,1977,1976,1975,1974,1973,1972,1971
This statistics in other country:
Timeline:
This timeline shows a graph from 1971 to 2016 of Morocco. No data until 1970. Number of actual observations by date: 46.
Source name:
World Development Indicators
Source organization:
World Bank, International Debt Statistics.
Categories, topics:
External Debt
Last updated:
apr 23, 2017
Indicators value changes by year
At the date of observation
Value
Absolute change
Change from previous value
jan 1, 1981
0.168
+0.168
%
jan 1, 1982
0.175
+0.007
3.86%
jan 1, 1983
0.154
-0.02
-11.62%
jan 1, 1984
0.193
+0.039
25.26%
jan 1, 1985
0.167
-0.027
-13.81%
jan 1, 1986
0.15
-0.016
-9.84%
jan 1, 1987
0.135
-0.015
-10.25%
jan 1, 1988
0.127
-0.008
-6.0%
jan 1, 1989
0.106
-0.021
-16.32%
jan 1, 1990
0.139
+0.033
30.82%
jan 1, 1991
0.097
-0.042
-30.33%
jan 1, 1992
0.247
+0.151
155.95%
jan 1, 1993
0.236
-0.012
-4.81%
jan 1, 1994
0.231
-0.005
-1.99%
jan 1, 1995
0.292
+0.061
26.5%
jan 1, 1996
0.236
-0.056
-19.17%
jan 1, 1997
0.203
-0.034
-14.19%
jan 1, 1998
0.171
-0.032
-15.6%
jan 1, 1999
0.155
-0.016
-9.42%
jan 1, 2000
0.194
+0.039
25.5%
jan 1, 2001
0.221
+0.026
13.53%
jan 1, 2002
0.287
+0.067
30.27%
jan 1, 2003
0.194
-0.094
-32.59%
jan 1, 2004
0.192
-0.001
-0.72%
jan 1, 2005
0.264
+0.071
37.01%
jan 1, 2006
0.29
+0.027
10.17%
jan 1, 2007
0.224
-0.067
-22.97%
jan 1, 2008
0.115
-0.108
-48.46%
jan 1, 2009
0.121
+0.006
5.2%
jan 1, 2010
1.113
+0.992
817.89%
jan 1, 2011
1.593
+0.48
43.08%
jan 1, 2012
1.803
+0.21
13.2%
jan 1, 2013
1.753
-0.05
-2.78%
jan 1, 2014
1.599
-0.155
-8.82%
jan 1, 2015
1.029
-0.57
-35.63%
jan 1, 2016
0.999
-0.03
-2.95%
Ranking of countries by current statistics by years


Comments: