29
/
en
AIzaSyAYiBZKx7MnpbEhh9jyipgxe19OcubqV5w
April 1, 2024
48680
Middle East & North Africa (excluding high income)
MNA
false
2
1
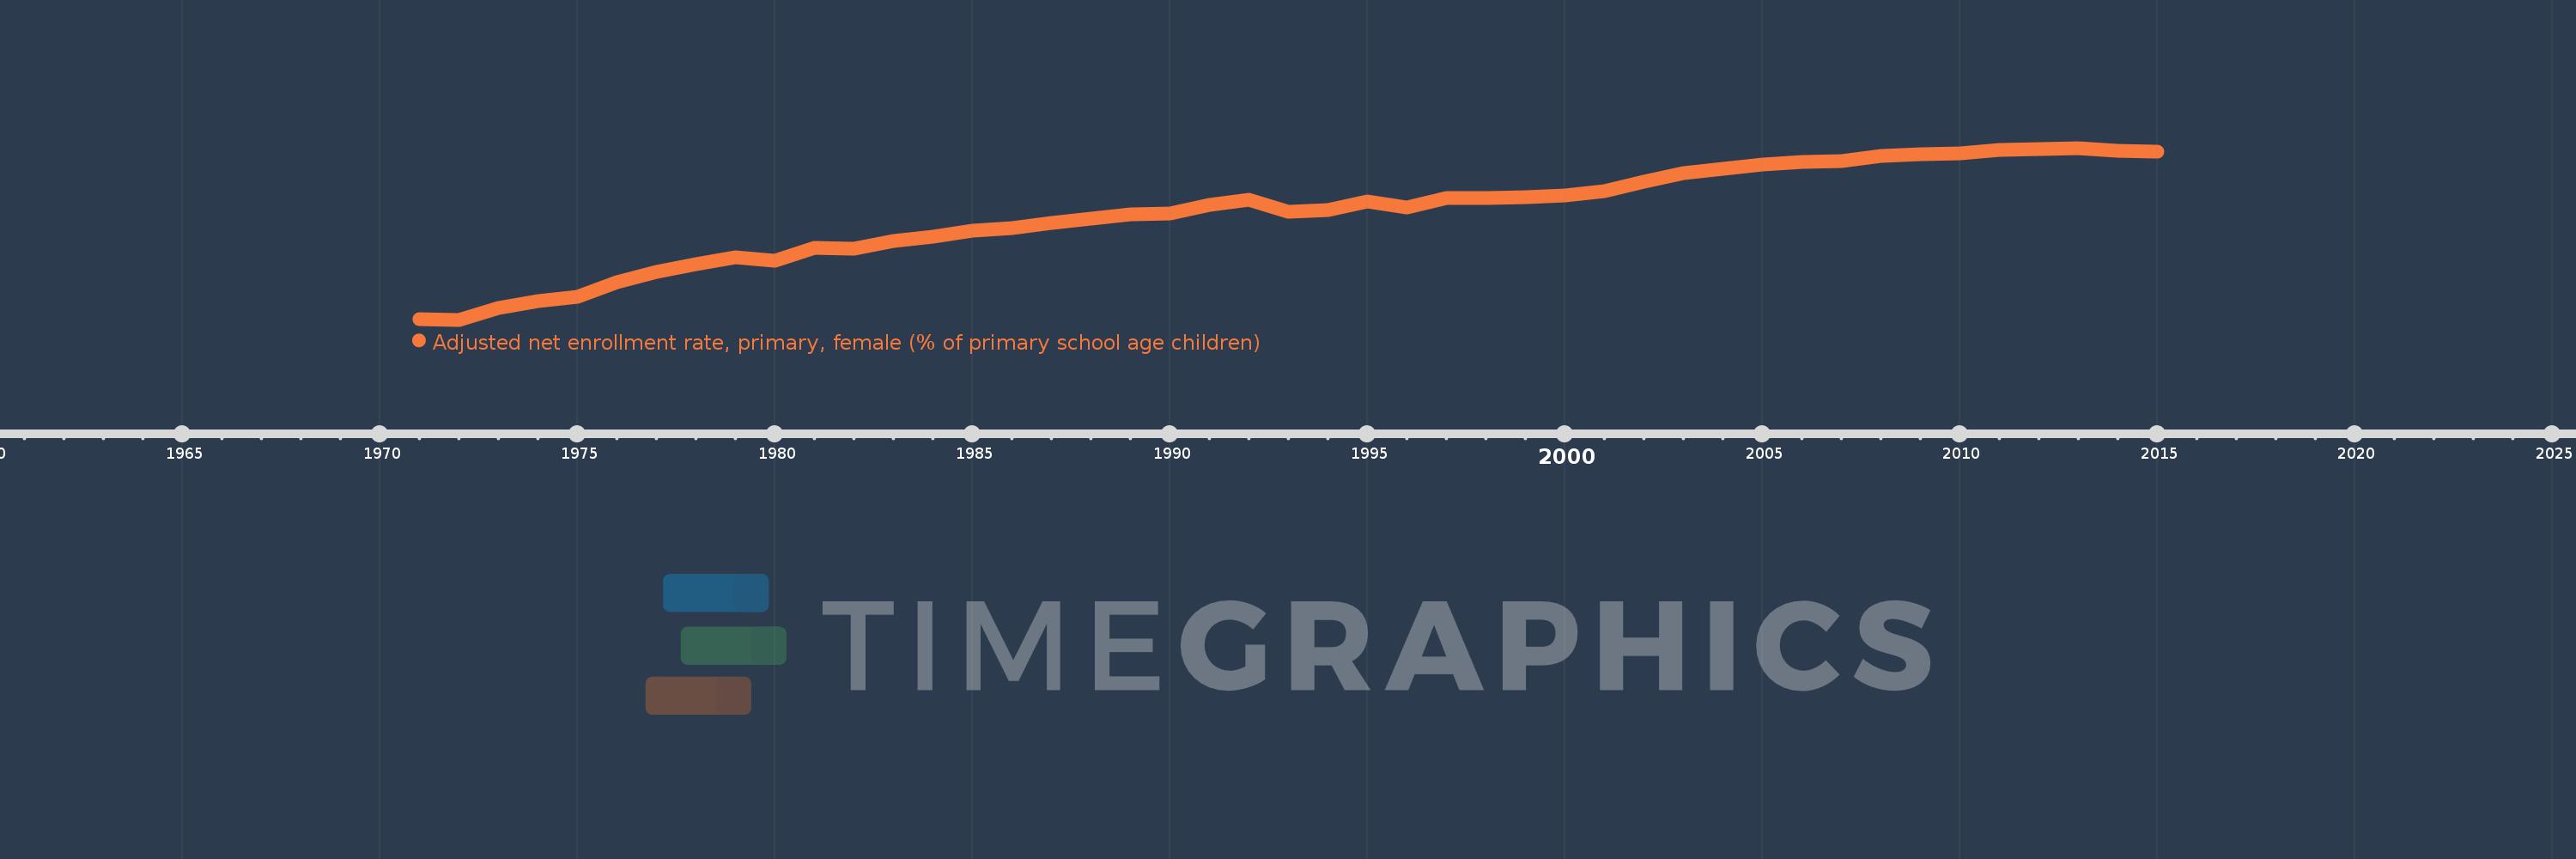
Adjusted net enrollment rate, primary, female (% of primary school age children)
2015,2014,2013,2012,2011,2010,2009,2008,2007,2006,2005,2004,2003,2002,2001,2000,1999,1998,1997,1996,1995,1994,1993,1992,1991,1990,1989,1988,1987,1986,1985,1984,1983,1982,1981,1980,1979,1978,1977,1976,1975,1974,1973,1972,1971
This statistics in other country:
AfghanistanAlbaniaAlgeriaAngolaAntigua and BarbudaArab WorldArgentinaArmeniaArubaAustraliaAustriaAzerbaijanBahamas, TheBahrainBangladeshBarbadosBelarusBelgiumBelizeBeninBermudaBhutanBoliviaBosnia and HerzegovinaBotswanaBrazilBrunei DarussalamBulgariaBurkina FasoBurundiCabo VerdeCambodiaCameroonCanadaCaribbean small statesCentral African RepublicCentral Europe and the BalticsChadChileChinaColombiaComorosCongo, Dem. Rep.Congo, Rep.Costa RicaCote d'IvoireCroatiaCubaCyprusDenmarkDjiboutiDominicaDominican RepublicEarly-demographic dividendEast Asia & PacificEast Asia & Pacific (excluding high income)East Asia & Pacific (IDA & IBRD countries)EcuadorEgypt, Arab Rep.El SalvadorEquatorial GuineaEritreaEstoniaEthiopiaEuro areaEurope & Central AsiaEurope & Central Asia (excluding high income)Europe & Central Asia (IDA & IBRD countries)European UnionFijiFinlandFragile and conflict affected situationsFranceGabonGambia, TheGeorgiaGhanaGreeceGrenadaGuatemalaGuineaGuinea-BissauGuyanaHaitiHeavily indebted poor countries (HIPC)High incomeHondurasHong Kong SAR, ChinaHungaryIBRD onlyIcelandIDA & IBRD totalIDA blendIDA onlyIDA totalIndiaIndonesiaIran, Islamic Rep.IraqIrelandIsraelItalyJamaicaJapanJordanKazakhstanKenyaKiribatiKorea, Dem. People’s Rep.Korea, Rep.KuwaitKyrgyz RepublicLao PDRLate-demographic dividendLatin America & Caribbean Latin America & Caribbean (excluding high income)Latin America & the Caribbean (IDA & IBRD countries)LatviaLeast developed countries: UN classificationLebanonLesothoLiberiaLibyaLiechtensteinLithuaniaLow & middle incomeLow incomeLower middle incomeLuxembourgMacao SAR, ChinaMacedonia, FYRMadagascarMalawiMaldivesMaliMaltaMarshall IslandsMauritaniaMauritiusMexicoMicronesia, Fed. Sts.Middle East & North AfricaMiddle East & North Africa (excluding high income)Middle East & North Africa (IDA & IBRD countries)Middle incomeMoldovaMongoliaMontenegroMoroccoMozambiqueMyanmarNamibiaNauruNepalNetherlandsNew ZealandNicaraguaNigerNigeriaNorth AmericaNorwayOECD membersOmanOther small statesPacific island small statesPakistanPanamaPapua New GuineaParaguayPeruPhilippinesPolandPortugalPost-demographic dividendPre-demographic dividendPuerto RicoQatarRomaniaRussian FederationRwandaSamoaSan MarinoSao Tome and PrincipeSaudi ArabiaSenegalSerbiaSeychellesSierra LeoneSloveniaSmall statesSolomon IslandsSomaliaSouth AfricaSouth AsiaSouth Asia (IDA & IBRD)South SudanSpainSri LankaSt. Kitts and NevisSt. LuciaSt. Vincent and the GrenadinesSub-Saharan Africa Sub-Saharan Africa (excluding high income)Sub-Saharan Africa (IDA & IBRD countries)SudanSurinameSwazilandSwedenSwitzerlandSyrian Arab RepublicTajikistanTanzaniaThailandTimor-LesteTogoTongaTrinidad and TobagoTunisiaTurkeyTuvaluUgandaUkraineUnited Arab EmiratesUnited KingdomUnited StatesUpper middle incomeUruguayUzbekistanVanuatuVenezuela, RBWest Bank and GazaWorldYemen, Rep.ZambiaZimbabwe Timeline:
This timeline shows a graph from 1971 to 2015 of Middle East & North Africa (excluding high income). No data until 1970. Number of actual observations by date: 45.
Source name:
World Development Indicators
Source organization:
United Nations Educational, Scientific, and Cultural Organization (UNESCO) Institute for Statistics.
Categories, topics:
Education, Gender
Last updated:
apr 23, 2017
Indicators value changes by year
Minimum:
45.029
jan 1, 1972
Maximum:
93.918
jan 1, 2013
At the date of observation
Value
Absolute change
Change from previous value
jan 1, 1971
45.081
+45.081
0.0%
jan 1, 1972
45.029
-0.052
-0.12%
jan 1, 1973
48.31
+3.281
7.29%
jan 1, 1974
50.278
+1.969
4.08%
jan 1, 1975
51.519
+1.24
2.47%
jan 1, 1976
55.611
+4.092
7.94%
jan 1, 1977
58.686
+3.075
5.53%
jan 1, 1978
60.96
+2.275
3.88%
jan 1, 1979
62.804
+1.844
3.02%
jan 1, 1980
61.766
-1.039
-1.65%
jan 1, 1981
65.599
+3.833
6.21%
jan 1, 1982
65.214
-0.385
-0.59%
jan 1, 1983
67.392
+2.178
3.34%
jan 1, 1984
68.617
+1.225
1.82%
jan 1, 1985
70.348
+1.732
2.52%
jan 1, 1986
71.18
+0.832
1.18%
jan 1, 1987
72.522
+1.342
1.89%
jan 1, 1988
73.872
+1.35
1.86%
jan 1, 1989
75.139
+1.267
1.72%
jan 1, 1990
75.337
+0.198
0.26%
jan 1, 1991
77.682
+2.345
3.11%
jan 1, 1992
79.18
+1.498
1.93%
jan 1, 1993
75.828
-3.352
-4.23%
jan 1, 1994
76.342
+0.514
0.68%
jan 1, 1995
78.752
+2.411
3.16%
jan 1, 1996
76.987
-1.765
-2.24%
jan 1, 1997
79.786
+2.799
3.64%
jan 1, 1998
79.61
-0.176
-0.22%
jan 1, 1999
79.882
+0.272
0.34%
jan 1, 2000
80.399
+0.518
0.65%
jan 1, 2001
81.579
+1.18
1.47%
jan 1, 2002
84.323
+2.744
3.36%
jan 1, 2003
86.764
+2.441
2.89%
jan 1, 2004
87.965
+1.202
1.38%
jan 1, 2005
89.322
+1.357
1.54%
jan 1, 2006
89.92
+0.598
0.67%
jan 1, 2007
90.293
+0.373
0.41%
jan 1, 2008
91.595
+1.302
1.44%
jan 1, 2009
92.024
+0.429
0.47%
jan 1, 2010
92.415
+0.39
0.42%
jan 1, 2011
93.401
+0.986
1.07%
jan 1, 2012
93.652
+0.251
0.27%
jan 1, 2013
93.918
+0.267
0.28%
jan 1, 2014
93.2
-0.719
-0.77%
jan 1, 2015
92.868
-0.331
-0.36%
Ranking of countries by current statistics by years


Comments: