29
/
en
AIzaSyAYiBZKx7MnpbEhh9jyipgxe19OcubqV5w
April 1, 2024
41180
Latin America & Caribbean
LCN
false
2
1
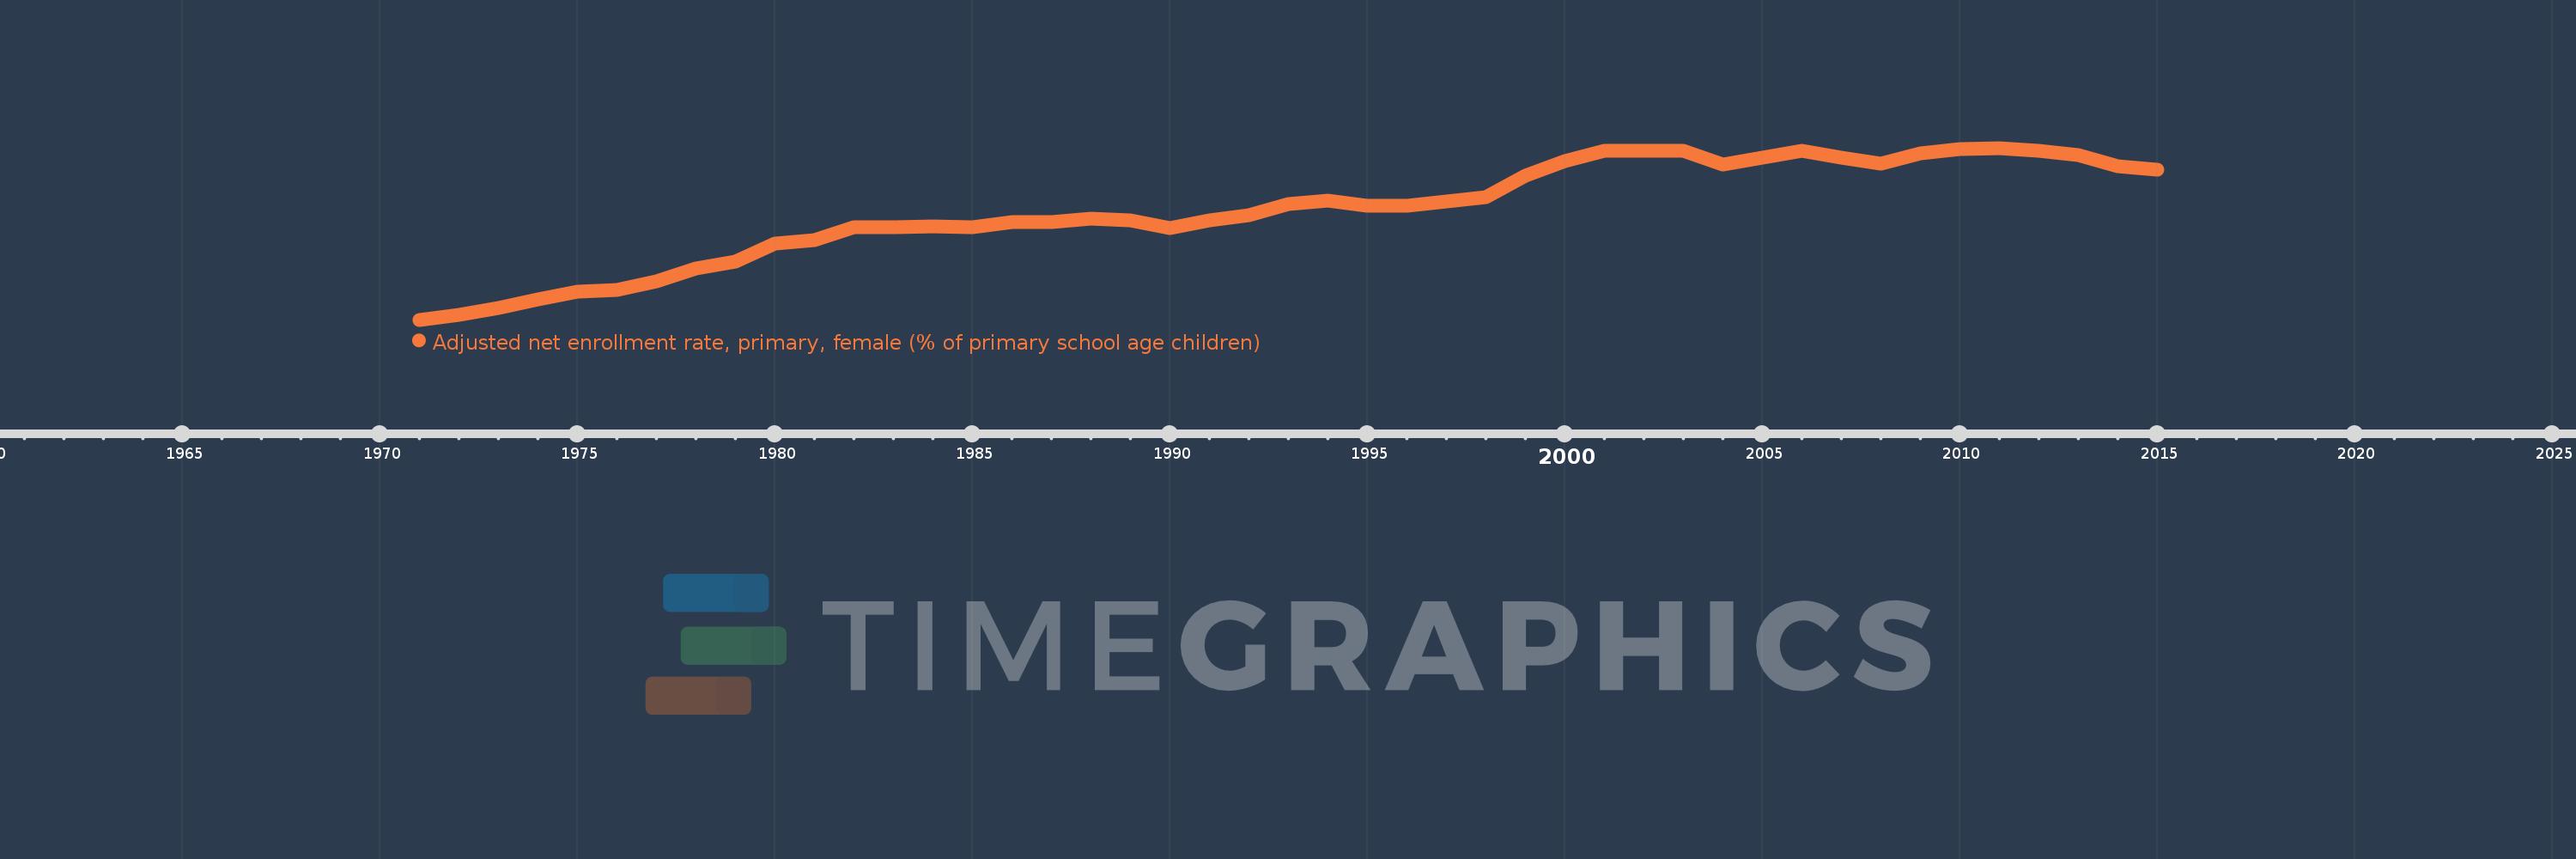
Adjusted net enrollment rate, primary, female (% of primary school age children)
2015,2014,2013,2012,2011,2010,2009,2008,2007,2006,2005,2004,2003,2002,2001,2000,1999,1998,1997,1996,1995,1994,1993,1992,1991,1990,1989,1988,1987,1986,1985,1984,1983,1982,1981,1980,1979,1978,1977,1976,1975,1974,1973,1972,1971
This statistics in other country:
AfghanistanAlbaniaAlgeriaAngolaAntigua and BarbudaArab WorldArgentinaArmeniaArubaAustraliaAustriaAzerbaijanBahamas, TheBahrainBangladeshBarbadosBelarusBelgiumBelizeBeninBermudaBhutanBoliviaBosnia and HerzegovinaBotswanaBrazilBrunei DarussalamBulgariaBurkina FasoBurundiCabo VerdeCambodiaCameroonCanadaCaribbean small statesCentral African RepublicCentral Europe and the BalticsChadChileChinaColombiaComorosCongo, Dem. Rep.Congo, Rep.Costa RicaCote d'IvoireCroatiaCubaCyprusDenmarkDjiboutiDominicaDominican RepublicEarly-demographic dividendEast Asia & PacificEast Asia & Pacific (excluding high income)East Asia & Pacific (IDA & IBRD countries)EcuadorEgypt, Arab Rep.El SalvadorEquatorial GuineaEritreaEstoniaEthiopiaEuro areaEurope & Central AsiaEurope & Central Asia (excluding high income)Europe & Central Asia (IDA & IBRD countries)European UnionFijiFinlandFragile and conflict affected situationsFranceGabonGambia, TheGeorgiaGhanaGreeceGrenadaGuatemalaGuineaGuinea-BissauGuyanaHaitiHeavily indebted poor countries (HIPC)High incomeHondurasHong Kong SAR, ChinaHungaryIBRD onlyIcelandIDA & IBRD totalIDA blendIDA onlyIDA totalIndiaIndonesiaIran, Islamic Rep.IraqIrelandIsraelItalyJamaicaJapanJordanKazakhstanKenyaKiribatiKorea, Dem. People’s Rep.Korea, Rep.KuwaitKyrgyz RepublicLao PDRLate-demographic dividendLatin America & Caribbean Latin America & Caribbean (excluding high income)Latin America & the Caribbean (IDA & IBRD countries)LatviaLeast developed countries: UN classificationLebanonLesothoLiberiaLibyaLiechtensteinLithuaniaLow & middle incomeLow incomeLower middle incomeLuxembourgMacao SAR, ChinaMacedonia, FYRMadagascarMalawiMaldivesMaliMaltaMarshall IslandsMauritaniaMauritiusMexicoMicronesia, Fed. Sts.Middle East & North AfricaMiddle East & North Africa (excluding high income)Middle East & North Africa (IDA & IBRD countries)Middle incomeMoldovaMongoliaMontenegroMoroccoMozambiqueMyanmarNamibiaNauruNepalNetherlandsNew ZealandNicaraguaNigerNigeriaNorth AmericaNorwayOECD membersOmanOther small statesPacific island small statesPakistanPanamaPapua New GuineaParaguayPeruPhilippinesPolandPortugalPost-demographic dividendPre-demographic dividendPuerto RicoQatarRomaniaRussian FederationRwandaSamoaSan MarinoSao Tome and PrincipeSaudi ArabiaSenegalSerbiaSeychellesSierra LeoneSloveniaSmall statesSolomon IslandsSomaliaSouth AfricaSouth AsiaSouth Asia (IDA & IBRD)South SudanSpainSri LankaSt. Kitts and NevisSt. LuciaSt. Vincent and the GrenadinesSub-Saharan Africa Sub-Saharan Africa (excluding high income)Sub-Saharan Africa (IDA & IBRD countries)SudanSurinameSwazilandSwedenSwitzerlandSyrian Arab RepublicTajikistanTanzaniaThailandTimor-LesteTogoTongaTrinidad and TobagoTunisiaTurkeyTuvaluUgandaUkraineUnited Arab EmiratesUnited KingdomUnited StatesUpper middle incomeUruguayUzbekistanVanuatuVenezuela, RBWest Bank and GazaWorldYemen, Rep.ZambiaZimbabwe Timeline:
This timeline shows a graph from 1971 to 2015 of Latin America & Caribbean . No data until 1970. Number of actual observations by date: 45.
Source name:
World Development Indicators
Source organization:
United Nations Educational, Scientific, and Cultural Organization (UNESCO) Institute for Statistics.
Categories, topics:
Education, Gender
Last updated:
apr 23, 2017
Indicators value changes by year
Minimum:
82.815
jan 1, 1971
Maximum:
95.819
jan 1, 2011
At the date of observation
Value
Absolute change
Change from previous value
jan 1, 1971
82.815
+82.815
0.0%
jan 1, 1972
83.193
+0.378
0.46%
jan 1, 1973
83.674
+0.481
0.58%
jan 1, 1974
84.349
+0.675
0.81%
jan 1, 1975
84.926
+0.577
0.68%
jan 1, 1976
85.078
+0.153
0.18%
jan 1, 1977
85.728
+0.65
0.76%
jan 1, 1978
86.673
+0.945
1.1%
jan 1, 1979
87.191
+0.518
0.6%
jan 1, 1980
88.601
+1.411
1.62%
jan 1, 1981
88.844
+0.242
0.27%
jan 1, 1982
89.811
+0.967
1.09%
jan 1, 1983
89.801
-0.009
-0.01%
jan 1, 1984
89.86
+0.059
0.07%
jan 1, 1985
89.843
-0.018
-0.02%
jan 1, 1986
90.223
+0.38
0.42%
jan 1, 1987
90.234
+0.011
0.01%
jan 1, 1988
90.484
+0.25
0.28%
jan 1, 1989
90.349
-0.135
-0.15%
jan 1, 1990
89.767
-0.582
-0.64%
jan 1, 1991
90.362
+0.595
0.66%
jan 1, 1992
90.74
+0.378
0.42%
jan 1, 1993
91.549
+0.809
0.89%
jan 1, 1994
91.833
+0.284
0.31%
jan 1, 1995
91.433
-0.4
-0.44%
jan 1, 1996
91.428
-0.005
0.0%
jan 1, 1997
91.756
+0.328
0.36%
jan 1, 1998
92.061
+0.305
0.33%
jan 1, 1999
93.711
+1.65
1.79%
jan 1, 2000
94.853
+1.142
1.22%
jan 1, 2001
95.618
+0.764
0.81%
jan 1, 2002
95.636
+0.018
0.02%
jan 1, 2003
95.576
-0.06
-0.06%
jan 1, 2004
94.581
-0.995
-1.04%
jan 1, 2005
95.069
+0.488
0.52%
jan 1, 2006
95.586
+0.517
0.54%
jan 1, 2007
95.055
-0.531
-0.56%
jan 1, 2008
94.606
-0.449
-0.47%
jan 1, 2009
95.384
+0.778
0.82%
jan 1, 2010
95.743
+0.359
0.38%
jan 1, 2011
95.819
+0.076
0.08%
jan 1, 2012
95.636
-0.183
-0.19%
jan 1, 2013
95.309
-0.327
-0.34%
jan 1, 2014
94.405
-0.904
-0.95%
jan 1, 2015
94.198
-0.206
-0.22%
Ranking of countries by current statistics by years


Comments: