29
/
en
AIzaSyAYiBZKx7MnpbEhh9jyipgxe19OcubqV5w
April 1, 2024
42051
Latin America & Caribbean (excluding high income)
LAC
false
2
1
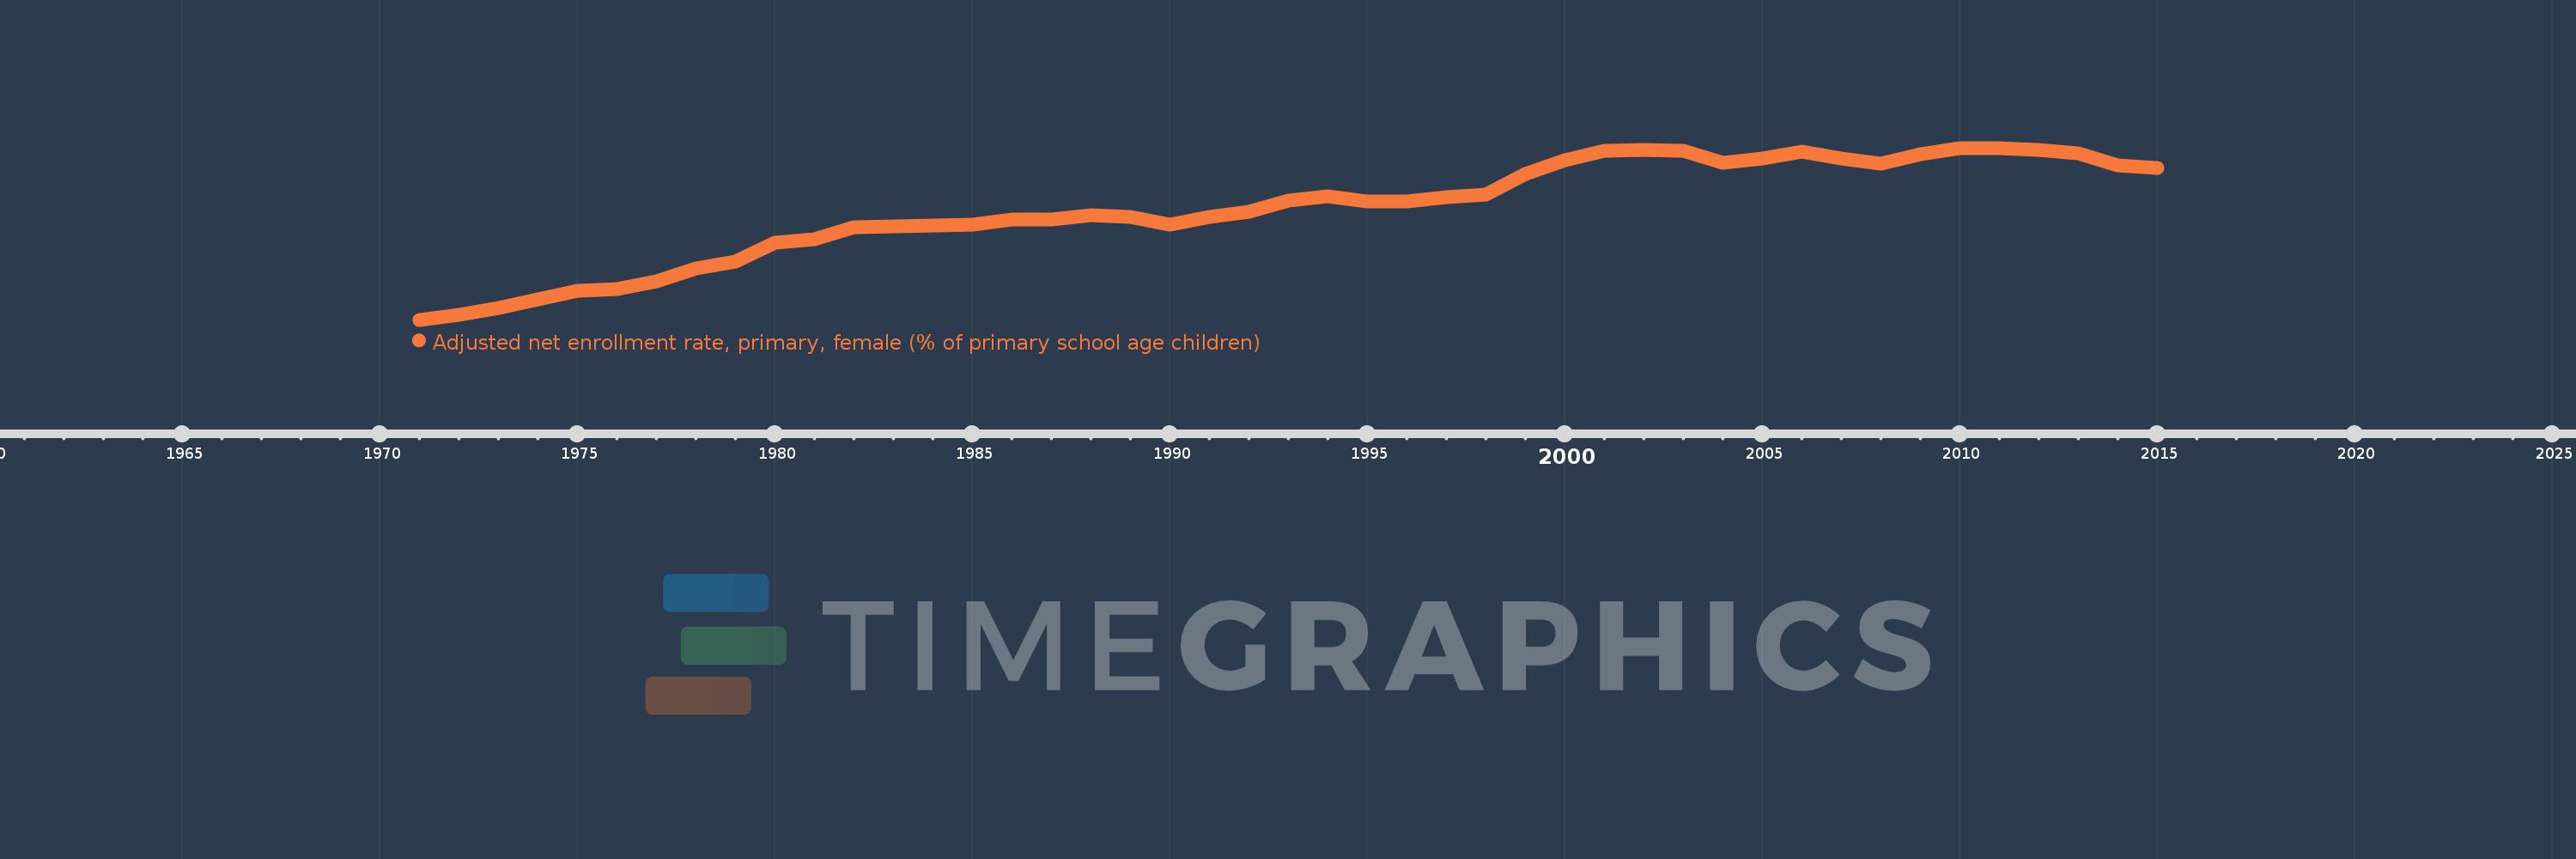
Adjusted net enrollment rate, primary, female (% of primary school age children)
2015,2014,2013,2012,2011,2010,2009,2008,2007,2006,2005,2004,2003,2002,2001,2000,1999,1998,1997,1996,1995,1994,1993,1992,1991,1990,1989,1988,1987,1986,1985,1984,1983,1982,1981,1980,1979,1978,1977,1976,1975,1974,1973,1972,1971
This statistics in other country:
AfghanistanAlbaniaAlgeriaAngolaAntigua and BarbudaArab WorldArgentinaArmeniaArubaAustraliaAustriaAzerbaijanBahamas, TheBahrainBangladeshBarbadosBelarusBelgiumBelizeBeninBermudaBhutanBoliviaBosnia and HerzegovinaBotswanaBrazilBrunei DarussalamBulgariaBurkina FasoBurundiCabo VerdeCambodiaCameroonCanadaCaribbean small statesCentral African RepublicCentral Europe and the BalticsChadChileChinaColombiaComorosCongo, Dem. Rep.Congo, Rep.Costa RicaCote d'IvoireCroatiaCubaCyprusDenmarkDjiboutiDominicaDominican RepublicEarly-demographic dividendEast Asia & PacificEast Asia & Pacific (excluding high income)East Asia & Pacific (IDA & IBRD countries)EcuadorEgypt, Arab Rep.El SalvadorEquatorial GuineaEritreaEstoniaEthiopiaEuro areaEurope & Central AsiaEurope & Central Asia (excluding high income)Europe & Central Asia (IDA & IBRD countries)European UnionFijiFinlandFragile and conflict affected situationsFranceGabonGambia, TheGeorgiaGhanaGreeceGrenadaGuatemalaGuineaGuinea-BissauGuyanaHaitiHeavily indebted poor countries (HIPC)High incomeHondurasHong Kong SAR, ChinaHungaryIBRD onlyIcelandIDA & IBRD totalIDA blendIDA onlyIDA totalIndiaIndonesiaIran, Islamic Rep.IraqIrelandIsraelItalyJamaicaJapanJordanKazakhstanKenyaKiribatiKorea, Dem. People’s Rep.Korea, Rep.KuwaitKyrgyz RepublicLao PDRLate-demographic dividendLatin America & Caribbean Latin America & Caribbean (excluding high income)Latin America & the Caribbean (IDA & IBRD countries)LatviaLeast developed countries: UN classificationLebanonLesothoLiberiaLibyaLiechtensteinLithuaniaLow & middle incomeLow incomeLower middle incomeLuxembourgMacao SAR, ChinaMacedonia, FYRMadagascarMalawiMaldivesMaliMaltaMarshall IslandsMauritaniaMauritiusMexicoMicronesia, Fed. Sts.Middle East & North AfricaMiddle East & North Africa (excluding high income)Middle East & North Africa (IDA & IBRD countries)Middle incomeMoldovaMongoliaMontenegroMoroccoMozambiqueMyanmarNamibiaNauruNepalNetherlandsNew ZealandNicaraguaNigerNigeriaNorth AmericaNorwayOECD membersOmanOther small statesPacific island small statesPakistanPanamaPapua New GuineaParaguayPeruPhilippinesPolandPortugalPost-demographic dividendPre-demographic dividendPuerto RicoQatarRomaniaRussian FederationRwandaSamoaSan MarinoSao Tome and PrincipeSaudi ArabiaSenegalSerbiaSeychellesSierra LeoneSloveniaSmall statesSolomon IslandsSomaliaSouth AfricaSouth AsiaSouth Asia (IDA & IBRD)South SudanSpainSri LankaSt. Kitts and NevisSt. LuciaSt. Vincent and the GrenadinesSub-Saharan Africa Sub-Saharan Africa (excluding high income)Sub-Saharan Africa (IDA & IBRD countries)SudanSurinameSwazilandSwedenSwitzerlandSyrian Arab RepublicTajikistanTanzaniaThailandTimor-LesteTogoTongaTrinidad and TobagoTunisiaTurkeyTuvaluUgandaUkraineUnited Arab EmiratesUnited KingdomUnited StatesUpper middle incomeUruguayUzbekistanVanuatuVenezuela, RBWest Bank and GazaWorldYemen, Rep.ZambiaZimbabwe Timeline:
This timeline shows a graph from 1971 to 2015 of Latin America & Caribbean (excluding high income). No data until 1970. Number of actual observations by date: 45.
Source name:
World Development Indicators
Source organization:
United Nations Educational, Scientific, and Cultural Organization (UNESCO) Institute for Statistics.
Categories, topics:
Education, Gender
Last updated:
apr 23, 2017
Indicators value changes by year
Minimum:
81.863
jan 1, 1971
Maximum:
95.846
jan 1, 2011
At the date of observation
Value
Absolute change
Change from previous value
jan 1, 1971
81.863
+81.863
0.0%
jan 1, 1972
82.271
+0.407
0.5%
jan 1, 1973
82.809
+0.538
0.65%
jan 1, 1974
83.533
+0.725
0.88%
jan 1, 1975
84.191
+0.658
0.79%
jan 1, 1976
84.356
+0.164
0.2%
jan 1, 1977
85.022
+0.666
0.79%
jan 1, 1978
86.025
+1.003
1.18%
jan 1, 1979
86.596
+0.571
0.66%
jan 1, 1980
88.145
+1.55
1.79%
jan 1, 1981
88.438
+0.292
0.33%
jan 1, 1982
89.389
+0.951
1.08%
jan 1, 1983
89.468
+0.079
0.09%
jan 1, 1984
89.562
+0.094
0.11%
jan 1, 1985
89.616
+0.054
0.06%
jan 1, 1986
89.988
+0.372
0.41%
jan 1, 1987
90.044
+0.056
0.06%
jan 1, 1988
90.348
+0.305
0.34%
jan 1, 1989
90.241
-0.108
-0.12%
jan 1, 1990
89.614
-0.627
-0.69%
jan 1, 1991
90.214
+0.6
0.67%
jan 1, 1992
90.629
+0.416
0.46%
jan 1, 1993
91.576
+0.947
1.04%
jan 1, 1994
91.882
+0.305
0.33%
jan 1, 1995
91.478
-0.403
-0.44%
jan 1, 1996
91.483
+0.005
0.0%
jan 1, 1997
91.835
+0.352
0.38%
jan 1, 1998
92.058
+0.224
0.24%
jan 1, 1999
93.732
+1.674
1.82%
jan 1, 2000
94.849
+1.117
1.19%
jan 1, 2001
95.64
+0.791
0.83%
jan 1, 2002
95.678
+0.038
0.04%
jan 1, 2003
95.626
-0.052
-0.05%
jan 1, 2004
94.62
-1.006
-1.05%
jan 1, 2005
94.997
+0.377
0.4%
jan 1, 2006
95.562
+0.566
0.6%
jan 1, 2007
95.009
-0.554
-0.58%
jan 1, 2008
94.542
-0.466
-0.49%
jan 1, 2009
95.359
+0.817
0.86%
jan 1, 2010
95.793
+0.434
0.46%
jan 1, 2011
95.846
+0.053
0.06%
jan 1, 2012
95.71
-0.136
-0.14%
jan 1, 2013
95.38
-0.33
-0.35%
jan 1, 2014
94.453
-0.927
-0.97%
jan 1, 2015
94.225
-0.228
-0.24%
Ranking of countries by current statistics by years


Comments: