29
/
en
AIzaSyAYiBZKx7MnpbEhh9jyipgxe19OcubqV5w
April 1, 2024
285454
Zambia
ZMB
true
2
1
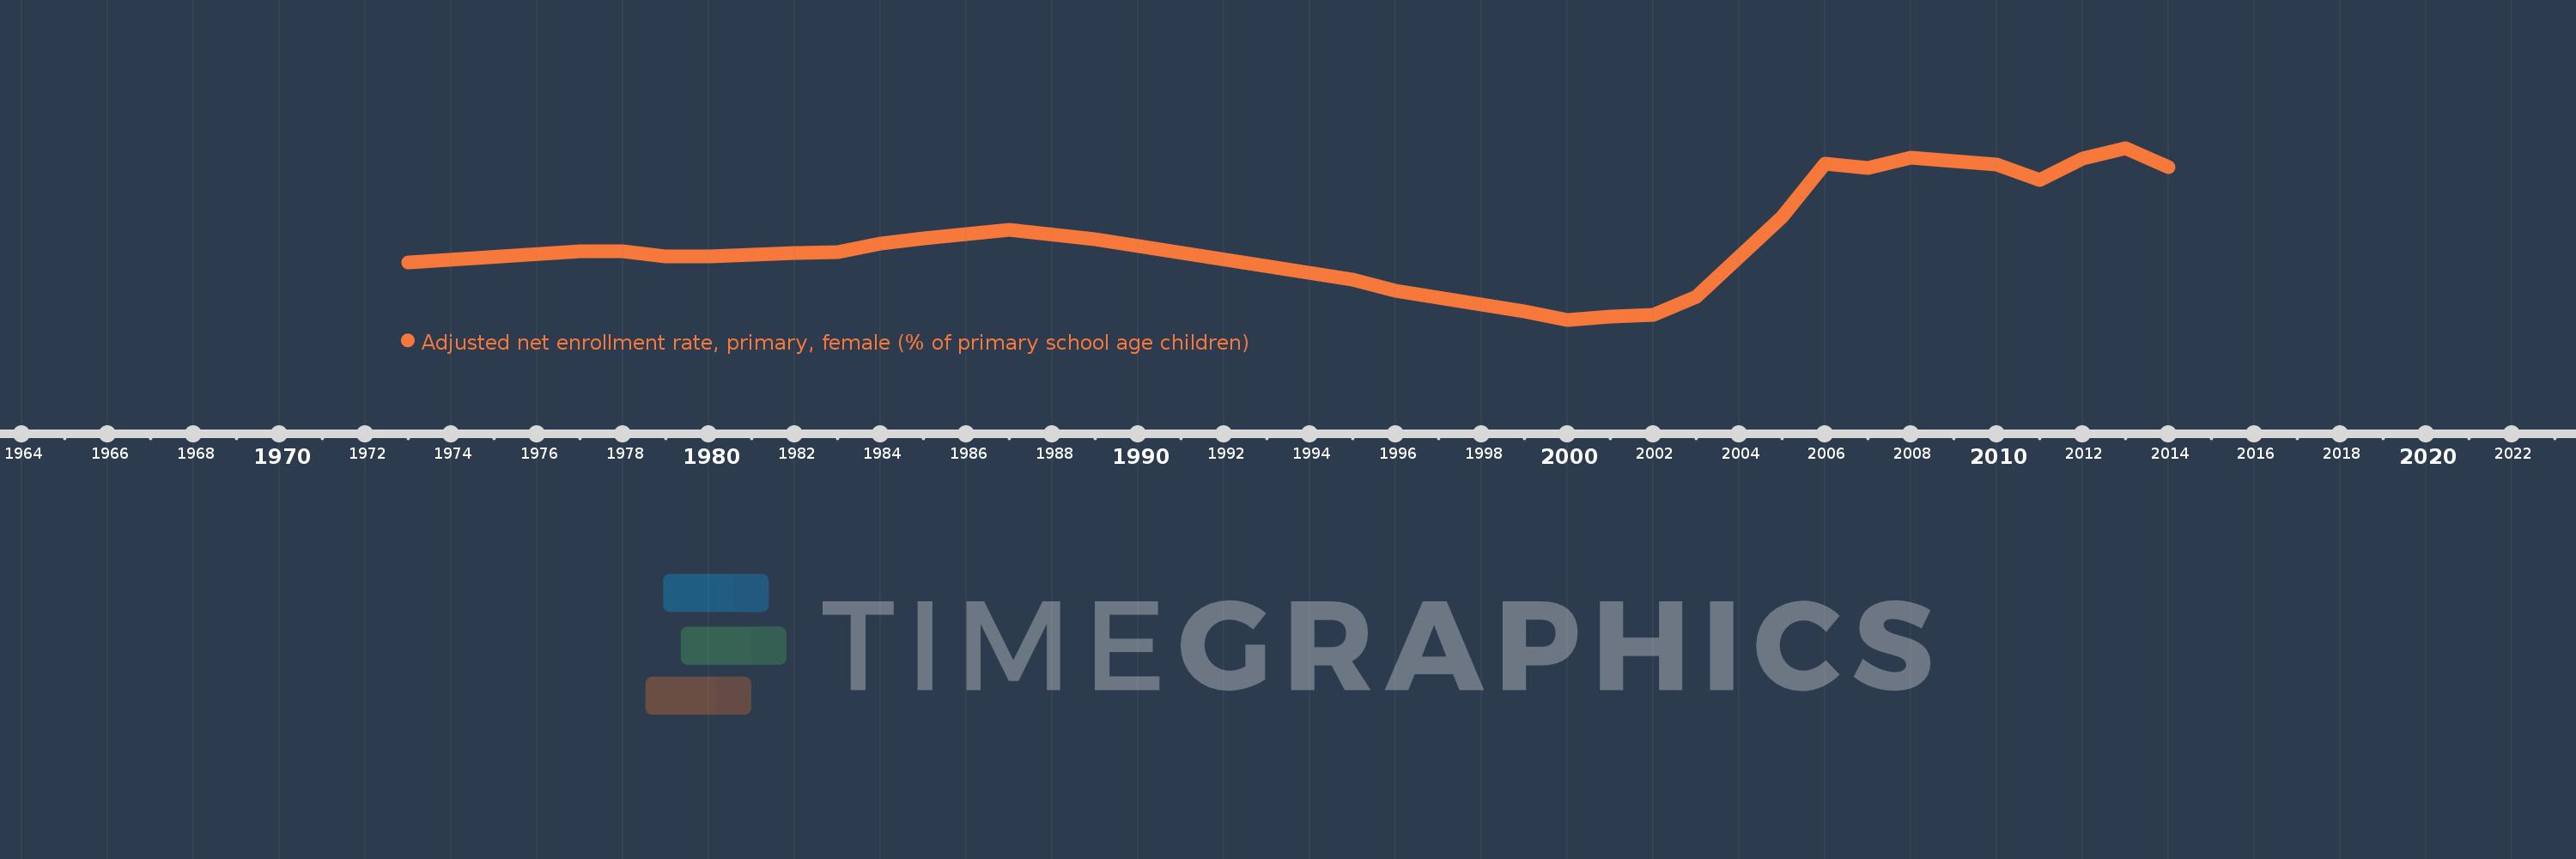
Adjusted net enrollment rate, primary, female (% of primary school age children)
2014,2013,2012,2011,2010,2008,2007,2006,2005,2003,2002,2001,2000,1999,1996,1995,1989,1987,1985,1984,1983,1982,1981,1980,1979,1978,1977,1973
This statistics in other country:
AfghanistanAlbaniaAlgeriaAngolaAntigua and BarbudaArab WorldArgentinaArmeniaArubaAustraliaAustriaAzerbaijanBahamas, TheBahrainBangladeshBarbadosBelarusBelgiumBelizeBeninBermudaBhutanBoliviaBosnia and HerzegovinaBotswanaBrazilBrunei DarussalamBulgariaBurkina FasoBurundiCabo VerdeCambodiaCameroonCanadaCaribbean small statesCentral African RepublicCentral Europe and the BalticsChadChileChinaColombiaComorosCongo, Dem. Rep.Congo, Rep.Costa RicaCote d'IvoireCroatiaCubaCyprusDenmarkDjiboutiDominicaDominican RepublicEarly-demographic dividendEast Asia & PacificEast Asia & Pacific (excluding high income)East Asia & Pacific (IDA & IBRD countries)EcuadorEgypt, Arab Rep.El SalvadorEquatorial GuineaEritreaEstoniaEthiopiaEuro areaEurope & Central AsiaEurope & Central Asia (excluding high income)Europe & Central Asia (IDA & IBRD countries)European UnionFijiFinlandFragile and conflict affected situationsFranceGabonGambia, TheGeorgiaGhanaGreeceGrenadaGuatemalaGuineaGuinea-BissauGuyanaHaitiHeavily indebted poor countries (HIPC)High incomeHondurasHong Kong SAR, ChinaHungaryIBRD onlyIcelandIDA & IBRD totalIDA blendIDA onlyIDA totalIndiaIndonesiaIran, Islamic Rep.IraqIrelandIsraelItalyJamaicaJapanJordanKazakhstanKenyaKiribatiKorea, Dem. People’s Rep.Korea, Rep.KuwaitKyrgyz RepublicLao PDRLate-demographic dividendLatin America & Caribbean Latin America & Caribbean (excluding high income)Latin America & the Caribbean (IDA & IBRD countries)LatviaLeast developed countries: UN classificationLebanonLesothoLiberiaLibyaLiechtensteinLithuaniaLow & middle incomeLow incomeLower middle incomeLuxembourgMacao SAR, ChinaMacedonia, FYRMadagascarMalawiMaldivesMaliMaltaMarshall IslandsMauritaniaMauritiusMexicoMicronesia, Fed. Sts.Middle East & North AfricaMiddle East & North Africa (excluding high income)Middle East & North Africa (IDA & IBRD countries)Middle incomeMoldovaMongoliaMontenegroMoroccoMozambiqueMyanmarNamibiaNauruNepalNetherlandsNew ZealandNicaraguaNigerNigeriaNorth AmericaNorwayOECD membersOmanOther small statesPacific island small statesPakistanPanamaPapua New GuineaParaguayPeruPhilippinesPolandPortugalPost-demographic dividendPre-demographic dividendPuerto RicoQatarRomaniaRussian FederationRwandaSamoaSan MarinoSao Tome and PrincipeSaudi ArabiaSenegalSerbiaSeychellesSierra LeoneSloveniaSmall statesSolomon IslandsSomaliaSouth AfricaSouth AsiaSouth Asia (IDA & IBRD)South SudanSpainSri LankaSt. Kitts and NevisSt. LuciaSt. Vincent and the GrenadinesSub-Saharan Africa Sub-Saharan Africa (excluding high income)Sub-Saharan Africa (IDA & IBRD countries)SudanSurinameSwazilandSwedenSwitzerlandSyrian Arab RepublicTajikistanTanzaniaThailandTimor-LesteTogoTongaTrinidad and TobagoTunisiaTurkeyTuvaluUgandaUkraineUnited Arab EmiratesUnited KingdomUnited StatesUpper middle incomeUruguayUzbekistanVanuatuVenezuela, RBWest Bank and GazaWorldYemen, Rep.ZambiaZimbabwe Timeline:
This timeline shows a graph from 1973 to 2014 of Zambia. No data until 1972. Number of actual observations by date: 28.
Source name:
World Development Indicators
Source organization:
United Nations Educational, Scientific, and Cultural Organization (UNESCO) Institute for Statistics.
Categories, topics:
Education, Gender
Last updated:
apr 23, 2017
Indicators value changes by year
Minimum:
63.724
jan 1, 2000
Maximum:
93.285
jan 1, 2013
At the date of observation
Value
Absolute change
Change from previous value
jan 1, 1973
73.587
+73.587
0.0%
jan 1, 1977
75.529
+1.942
2.64%
jan 1, 1978
75.453
-0.076
-0.1%
jan 1, 1979
74.62
-0.833
-1.1%
jan 1, 1980
74.57
-0.05
-0.07%
jan 1, 1981
74.867
+0.297
0.4%
jan 1, 1982
75.259
+0.392
0.52%
jan 1, 1983
75.314
+0.055
0.07%
jan 1, 1984
76.83
+1.516
2.01%
jan 1, 1985
77.725
+0.895
1.17%
jan 1, 1987
79.201
+1.476
1.9%
jan 1, 1989
77.554
-1.647
-2.08%
jan 1, 1995
70.691
-6.863
-8.85%
jan 1, 1996
68.671
-2.02
-2.86%
jan 1, 1999
65.182
-3.489
-5.08%
jan 1, 2000
63.724
-1.458
-2.24%
jan 1, 2001
64.252
+0.528
0.83%
jan 1, 2002
64.591
+0.338
0.53%
jan 1, 2003
67.602
+3.011
4.66%
jan 1, 2005
81.422
+13.82
20.44%
jan 1, 2006
90.654
+9.232
11.34%
jan 1, 2007
89.79
-0.864
-0.95%
jan 1, 2008
91.572
+1.782
1.99%
jan 1, 2010
90.362
-1.21
-1.32%
jan 1, 2011
87.698
-2.664
-2.95%
jan 1, 2012
91.489
+3.791
4.32%
jan 1, 2013
93.285
+1.796
1.96%
jan 1, 2014
90.028
-3.258
-3.49%
Ranking of countries by current statistics by years


Comments: