29
/
en
AIzaSyAYiBZKx7MnpbEhh9jyipgxe19OcubqV5w
April 1, 2024
34713
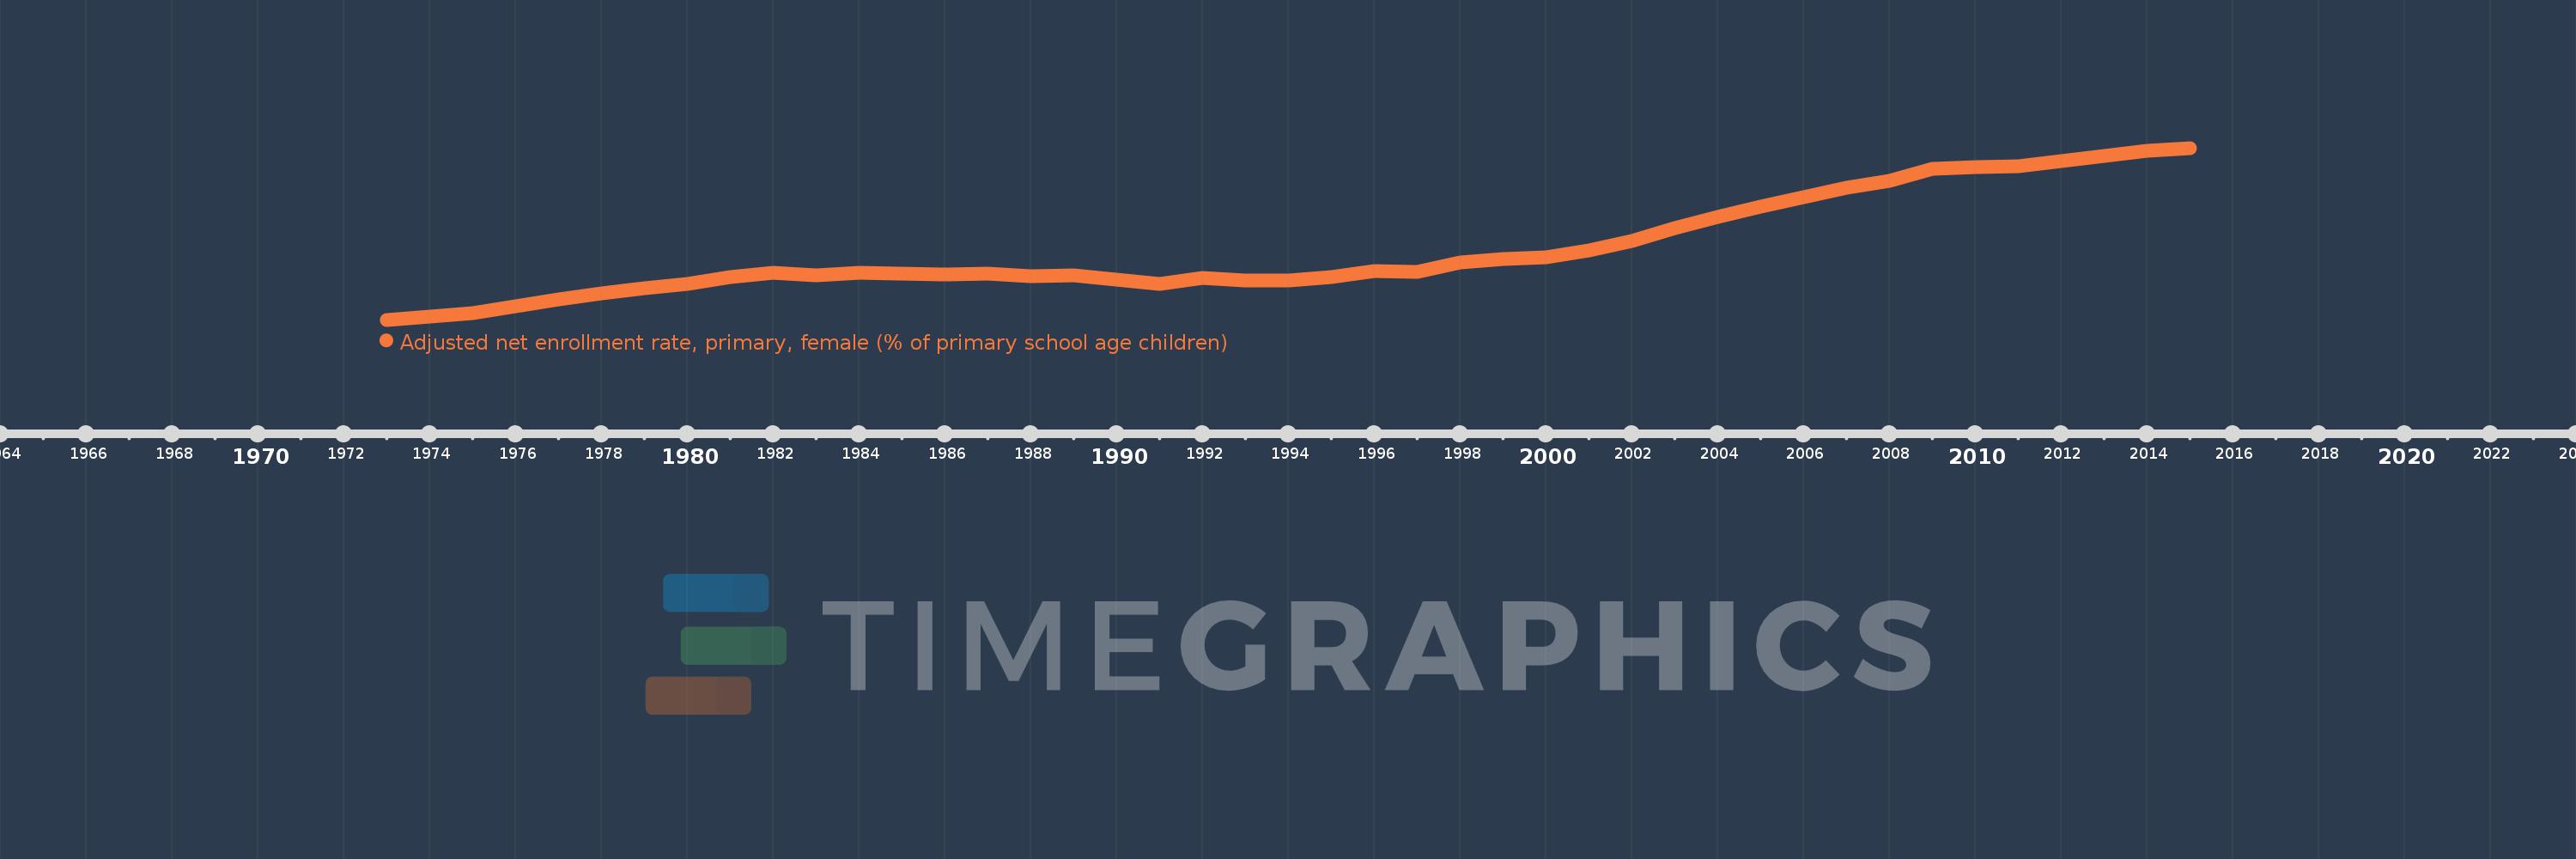
Heavily indebted poor countries (HIPC)
HPC
false
2
1
Adjusted net enrollment rate, primary, female (% of primary school age children)
2015,2014,2013,2012,2011,2010,2009,2008,2007,2006,2005,2004,2003,2002,2001,2000,1999,1998,1997,1996,1995,1994,1993,1992,1991,1990,1989,1988,1987,1986,1985,1984,1983,1982,1981,1980,1979,1978,1977,1976,1975,1974,1973
This statistics in other country:
AfghanistanAlbaniaAlgeriaAngolaAntigua and BarbudaArab WorldArgentinaArmeniaArubaAustraliaAustriaAzerbaijanBahamas, TheBahrainBangladeshBarbadosBelarusBelgiumBelizeBeninBermudaBhutanBoliviaBosnia and HerzegovinaBotswanaBrazilBrunei DarussalamBulgariaBurkina FasoBurundiCabo VerdeCambodiaCameroonCanadaCaribbean small statesCentral African RepublicCentral Europe and the BalticsChadChileChinaColombiaComorosCongo, Dem. Rep.Congo, Rep.Costa RicaCote d'IvoireCroatiaCubaCyprusDenmarkDjiboutiDominicaDominican RepublicEarly-demographic dividendEast Asia & PacificEast Asia & Pacific (excluding high income)East Asia & Pacific (IDA & IBRD countries)EcuadorEgypt, Arab Rep.El SalvadorEquatorial GuineaEritreaEstoniaEthiopiaEuro areaEurope & Central AsiaEurope & Central Asia (excluding high income)Europe & Central Asia (IDA & IBRD countries)European UnionFijiFinlandFragile and conflict affected situationsFranceGabonGambia, TheGeorgiaGhanaGreeceGrenadaGuatemalaGuineaGuinea-BissauGuyanaHaitiHeavily indebted poor countries (HIPC)High incomeHondurasHong Kong SAR, ChinaHungaryIBRD onlyIcelandIDA & IBRD totalIDA blendIDA onlyIDA totalIndiaIndonesiaIran, Islamic Rep.IraqIrelandIsraelItalyJamaicaJapanJordanKazakhstanKenyaKiribatiKorea, Dem. People’s Rep.Korea, Rep.KuwaitKyrgyz RepublicLao PDRLate-demographic dividendLatin America & Caribbean Latin America & Caribbean (excluding high income)Latin America & the Caribbean (IDA & IBRD countries)LatviaLeast developed countries: UN classificationLebanonLesothoLiberiaLibyaLiechtensteinLithuaniaLow & middle incomeLow incomeLower middle incomeLuxembourgMacao SAR, ChinaMacedonia, FYRMadagascarMalawiMaldivesMaliMaltaMarshall IslandsMauritaniaMauritiusMexicoMicronesia, Fed. Sts.Middle East & North AfricaMiddle East & North Africa (excluding high income)Middle East & North Africa (IDA & IBRD countries)Middle incomeMoldovaMongoliaMontenegroMoroccoMozambiqueMyanmarNamibiaNauruNepalNetherlandsNew ZealandNicaraguaNigerNigeriaNorth AmericaNorwayOECD membersOmanOther small statesPacific island small statesPakistanPanamaPapua New GuineaParaguayPeruPhilippinesPolandPortugalPost-demographic dividendPre-demographic dividendPuerto RicoQatarRomaniaRussian FederationRwandaSamoaSan MarinoSao Tome and PrincipeSaudi ArabiaSenegalSerbiaSeychellesSierra LeoneSloveniaSmall statesSolomon IslandsSomaliaSouth AfricaSouth AsiaSouth Asia (IDA & IBRD)South SudanSpainSri LankaSt. Kitts and NevisSt. LuciaSt. Vincent and the GrenadinesSub-Saharan Africa Sub-Saharan Africa (excluding high income)Sub-Saharan Africa (IDA & IBRD countries)SudanSurinameSwazilandSwedenSwitzerlandSyrian Arab RepublicTajikistanTanzaniaThailandTimor-LesteTogoTongaTrinidad and TobagoTunisiaTurkeyTuvaluUgandaUkraineUnited Arab EmiratesUnited KingdomUnited StatesUpper middle incomeUruguayUzbekistanVanuatuVenezuela, RBWest Bank and GazaWorldYemen, Rep.ZambiaZimbabwe Timeline:
This timeline shows a graph from 1973 to 2015 of Heavily indebted poor countries (HIPC). No data until 1972. Number of actual observations by date: 43.
Source name:
World Development Indicators
Source organization:
United Nations Educational, Scientific, and Cultural Organization (UNESCO) Institute for Statistics.
Categories, topics:
Education, Gender
Last updated:
apr 23, 2017
Indicators value changes by year
Minimum:
29.998
jan 1, 1973
Maximum:
78.576
jan 1, 2015
At the date of observation
Value
Absolute change
Change from previous value
jan 1, 1973
29.998
+29.998
0.0%
jan 1, 1974
31.002
+1.004
3.35%
jan 1, 1975
31.861
+0.859
2.77%
jan 1, 1976
33.705
+1.844
5.79%
jan 1, 1977
35.735
+2.03
6.02%
jan 1, 1978
37.401
+1.666
4.66%
jan 1, 1979
38.835
+1.434
3.83%
jan 1, 1980
40.108
+1.273
3.28%
jan 1, 1981
41.956
+1.848
4.61%
jan 1, 1982
43.243
+1.288
3.07%
jan 1, 1983
42.493
-0.75
-1.74%
jan 1, 1984
43.218
+0.725
1.71%
jan 1, 1985
43.001
-0.217
-0.5%
jan 1, 1986
42.818
-0.183
-0.42%
jan 1, 1987
43.015
+0.196
0.46%
jan 1, 1988
42.323
-0.692
-1.61%
jan 1, 1989
42.435
+0.113
0.27%
jan 1, 1990
41.318
-1.117
-2.63%
jan 1, 1991
40.215
-1.104
-2.67%
jan 1, 1992
41.808
+1.593
3.96%
jan 1, 1993
41.086
-0.721
-1.73%
jan 1, 1994
41.033
-0.053
-0.13%
jan 1, 1995
42.121
+1.088
2.65%
jan 1, 1996
43.822
+1.701
4.04%
jan 1, 1997
43.587
-0.235
-0.54%
jan 1, 1998
46.296
+2.709
6.22%
jan 1, 1999
47.202
+0.906
1.96%
jan 1, 2000
47.622
+0.42
0.89%
jan 1, 2001
49.501
+1.879
3.94%
jan 1, 2002
52.31
+2.809
5.67%
jan 1, 2003
56.012
+3.702
7.08%
jan 1, 2004
59.131
+3.118
5.57%
jan 1, 2005
62.057
+2.926
4.95%
jan 1, 2006
64.728
+2.671
4.3%
jan 1, 2007
67.382
+2.654
4.1%
jan 1, 2008
69.39
+2.008
2.98%
jan 1, 2009
72.781
+3.391
4.89%
jan 1, 2010
73.159
+0.377
0.52%
jan 1, 2011
73.323
+0.165
0.23%
jan 1, 2012
74.872
+1.548
2.11%
jan 1, 2013
76.43
+1.559
2.08%
jan 1, 2014
77.681
+1.251
1.64%
jan 1, 2015
78.576
+0.895
1.15%
Ranking of countries by current statistics by years


Comments: