29
/
en
AIzaSyAYiBZKx7MnpbEhh9jyipgxe19OcubqV5w
April 1, 2024
47878
Middle East & North Africa
MEA
false
2
1
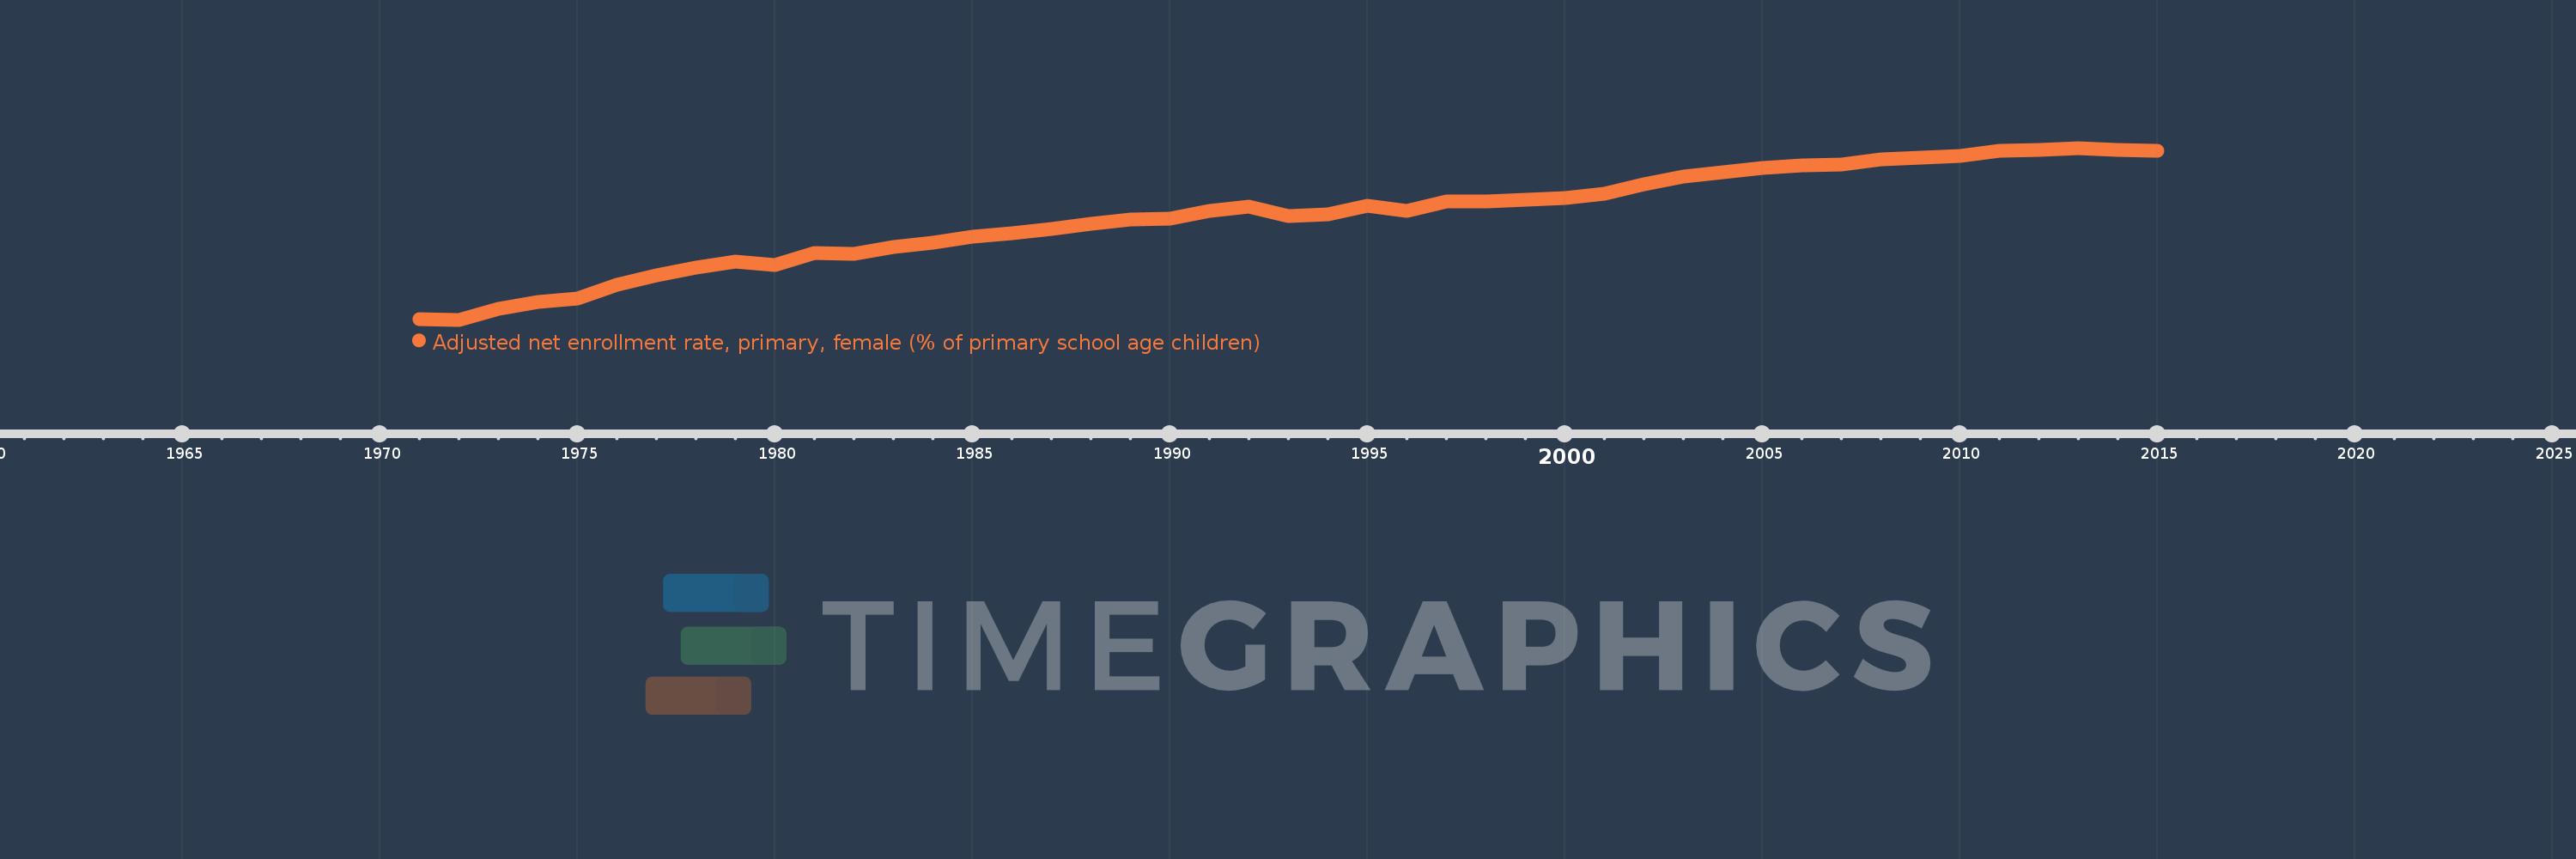
Adjusted net enrollment rate, primary, female (% of primary school age children)
2015,2014,2013,2012,2011,2010,2009,2008,2007,2006,2005,2004,2003,2002,2001,2000,1999,1998,1997,1996,1995,1994,1993,1992,1991,1990,1989,1988,1987,1986,1985,1984,1983,1982,1981,1980,1979,1978,1977,1976,1975,1974,1973,1972,1971
This statistics in other country:
AfghanistanAlbaniaAlgeriaAngolaAntigua and BarbudaArab WorldArgentinaArmeniaArubaAustraliaAustriaAzerbaijanBahamas, TheBahrainBangladeshBarbadosBelarusBelgiumBelizeBeninBermudaBhutanBoliviaBosnia and HerzegovinaBotswanaBrazilBrunei DarussalamBulgariaBurkina FasoBurundiCabo VerdeCambodiaCameroonCanadaCaribbean small statesCentral African RepublicCentral Europe and the BalticsChadChileChinaColombiaComorosCongo, Dem. Rep.Congo, Rep.Costa RicaCote d'IvoireCroatiaCubaCyprusDenmarkDjiboutiDominicaDominican RepublicEarly-demographic dividendEast Asia & PacificEast Asia & Pacific (excluding high income)East Asia & Pacific (IDA & IBRD countries)EcuadorEgypt, Arab Rep.El SalvadorEquatorial GuineaEritreaEstoniaEthiopiaEuro areaEurope & Central AsiaEurope & Central Asia (excluding high income)Europe & Central Asia (IDA & IBRD countries)European UnionFijiFinlandFragile and conflict affected situationsFranceGabonGambia, TheGeorgiaGhanaGreeceGrenadaGuatemalaGuineaGuinea-BissauGuyanaHaitiHeavily indebted poor countries (HIPC)High incomeHondurasHong Kong SAR, ChinaHungaryIBRD onlyIcelandIDA & IBRD totalIDA blendIDA onlyIDA totalIndiaIndonesiaIran, Islamic Rep.IraqIrelandIsraelItalyJamaicaJapanJordanKazakhstanKenyaKiribatiKorea, Dem. People’s Rep.Korea, Rep.KuwaitKyrgyz RepublicLao PDRLate-demographic dividendLatin America & Caribbean Latin America & Caribbean (excluding high income)Latin America & the Caribbean (IDA & IBRD countries)LatviaLeast developed countries: UN classificationLebanonLesothoLiberiaLibyaLiechtensteinLithuaniaLow & middle incomeLow incomeLower middle incomeLuxembourgMacao SAR, ChinaMacedonia, FYRMadagascarMalawiMaldivesMaliMaltaMarshall IslandsMauritaniaMauritiusMexicoMicronesia, Fed. Sts.Middle East & North AfricaMiddle East & North Africa (excluding high income)Middle East & North Africa (IDA & IBRD countries)Middle incomeMoldovaMongoliaMontenegroMoroccoMozambiqueMyanmarNamibiaNauruNepalNetherlandsNew ZealandNicaraguaNigerNigeriaNorth AmericaNorwayOECD membersOmanOther small statesPacific island small statesPakistanPanamaPapua New GuineaParaguayPeruPhilippinesPolandPortugalPost-demographic dividendPre-demographic dividendPuerto RicoQatarRomaniaRussian FederationRwandaSamoaSan MarinoSao Tome and PrincipeSaudi ArabiaSenegalSerbiaSeychellesSierra LeoneSloveniaSmall statesSolomon IslandsSomaliaSouth AfricaSouth AsiaSouth Asia (IDA & IBRD)South SudanSpainSri LankaSt. Kitts and NevisSt. LuciaSt. Vincent and the GrenadinesSub-Saharan Africa Sub-Saharan Africa (excluding high income)Sub-Saharan Africa (IDA & IBRD countries)SudanSurinameSwazilandSwedenSwitzerlandSyrian Arab RepublicTajikistanTanzaniaThailandTimor-LesteTogoTongaTrinidad and TobagoTunisiaTurkeyTuvaluUgandaUkraineUnited Arab EmiratesUnited KingdomUnited StatesUpper middle incomeUruguayUzbekistanVanuatuVenezuela, RBWest Bank and GazaWorldYemen, Rep.ZambiaZimbabwe Timeline:
This timeline shows a graph from 1971 to 2015 of Middle East & North Africa. No data until 1970. Number of actual observations by date: 45.
Source name:
World Development Indicators
Source organization:
United Nations Educational, Scientific, and Cultural Organization (UNESCO) Institute for Statistics.
Categories, topics:
Education, Gender
Last updated:
apr 23, 2017
Indicators value changes by year
Minimum:
45.116
jan 1, 1972
Maximum:
94.076
jan 1, 2013
At the date of observation
Value
Absolute change
Change from previous value
jan 1, 1971
45.189
+45.189
0.0%
jan 1, 1972
45.116
-0.073
-0.16%
jan 1, 1973
48.214
+3.098
6.87%
jan 1, 1974
50.064
+1.85
3.84%
jan 1, 1975
51.21
+1.146
2.29%
jan 1, 1976
55.004
+3.793
7.41%
jan 1, 1977
57.848
+2.844
5.17%
jan 1, 1978
59.967
+2.119
3.66%
jan 1, 1979
61.655
+1.689
2.82%
jan 1, 1980
60.643
-1.012
-1.64%
jan 1, 1981
64.209
+3.566
5.88%
jan 1, 1982
63.882
-0.327
-0.51%
jan 1, 1983
65.936
+2.054
3.22%
jan 1, 1984
67.142
+1.205
1.83%
jan 1, 1985
68.84
+1.699
2.53%
jan 1, 1986
69.719
+0.879
1.28%
jan 1, 1987
71.104
+1.385
1.99%
jan 1, 1988
72.44
+1.336
1.88%
jan 1, 1989
73.697
+1.257
1.73%
jan 1, 1990
73.97
+0.274
0.37%
jan 1, 1991
76.111
+2.14
2.89%
jan 1, 1992
77.464
+1.353
1.78%
jan 1, 1993
74.562
-2.902
-3.75%
jan 1, 1994
75.204
+0.642
0.86%
jan 1, 1995
77.534
+2.33
3.1%
jan 1, 1996
76.163
-1.371
-1.77%
jan 1, 1997
78.86
+2.697
3.54%
jan 1, 1998
78.875
+0.016
0.02%
jan 1, 1999
79.328
+0.452
0.57%
jan 1, 2000
79.922
+0.595
0.75%
jan 1, 2001
81.112
+1.19
1.49%
jan 1, 2002
83.702
+2.59
3.19%
jan 1, 2003
85.982
+2.279
2.72%
jan 1, 2004
87.125
+1.143
1.33%
jan 1, 2005
88.432
+1.307
1.5%
jan 1, 2006
89.104
+0.672
0.76%
jan 1, 2007
89.471
+0.367
0.41%
jan 1, 2008
90.769
+1.298
1.45%
jan 1, 2009
91.315
+0.546
0.6%
jan 1, 2010
91.888
+0.573
0.63%
jan 1, 2011
93.307
+1.419
1.54%
jan 1, 2012
93.589
+0.282
0.3%
jan 1, 2013
94.076
+0.487
0.52%
jan 1, 2014
93.506
-0.569
-0.61%
jan 1, 2015
93.215
-0.291
-0.31%
Ranking of countries by current statistics by years


Comments: