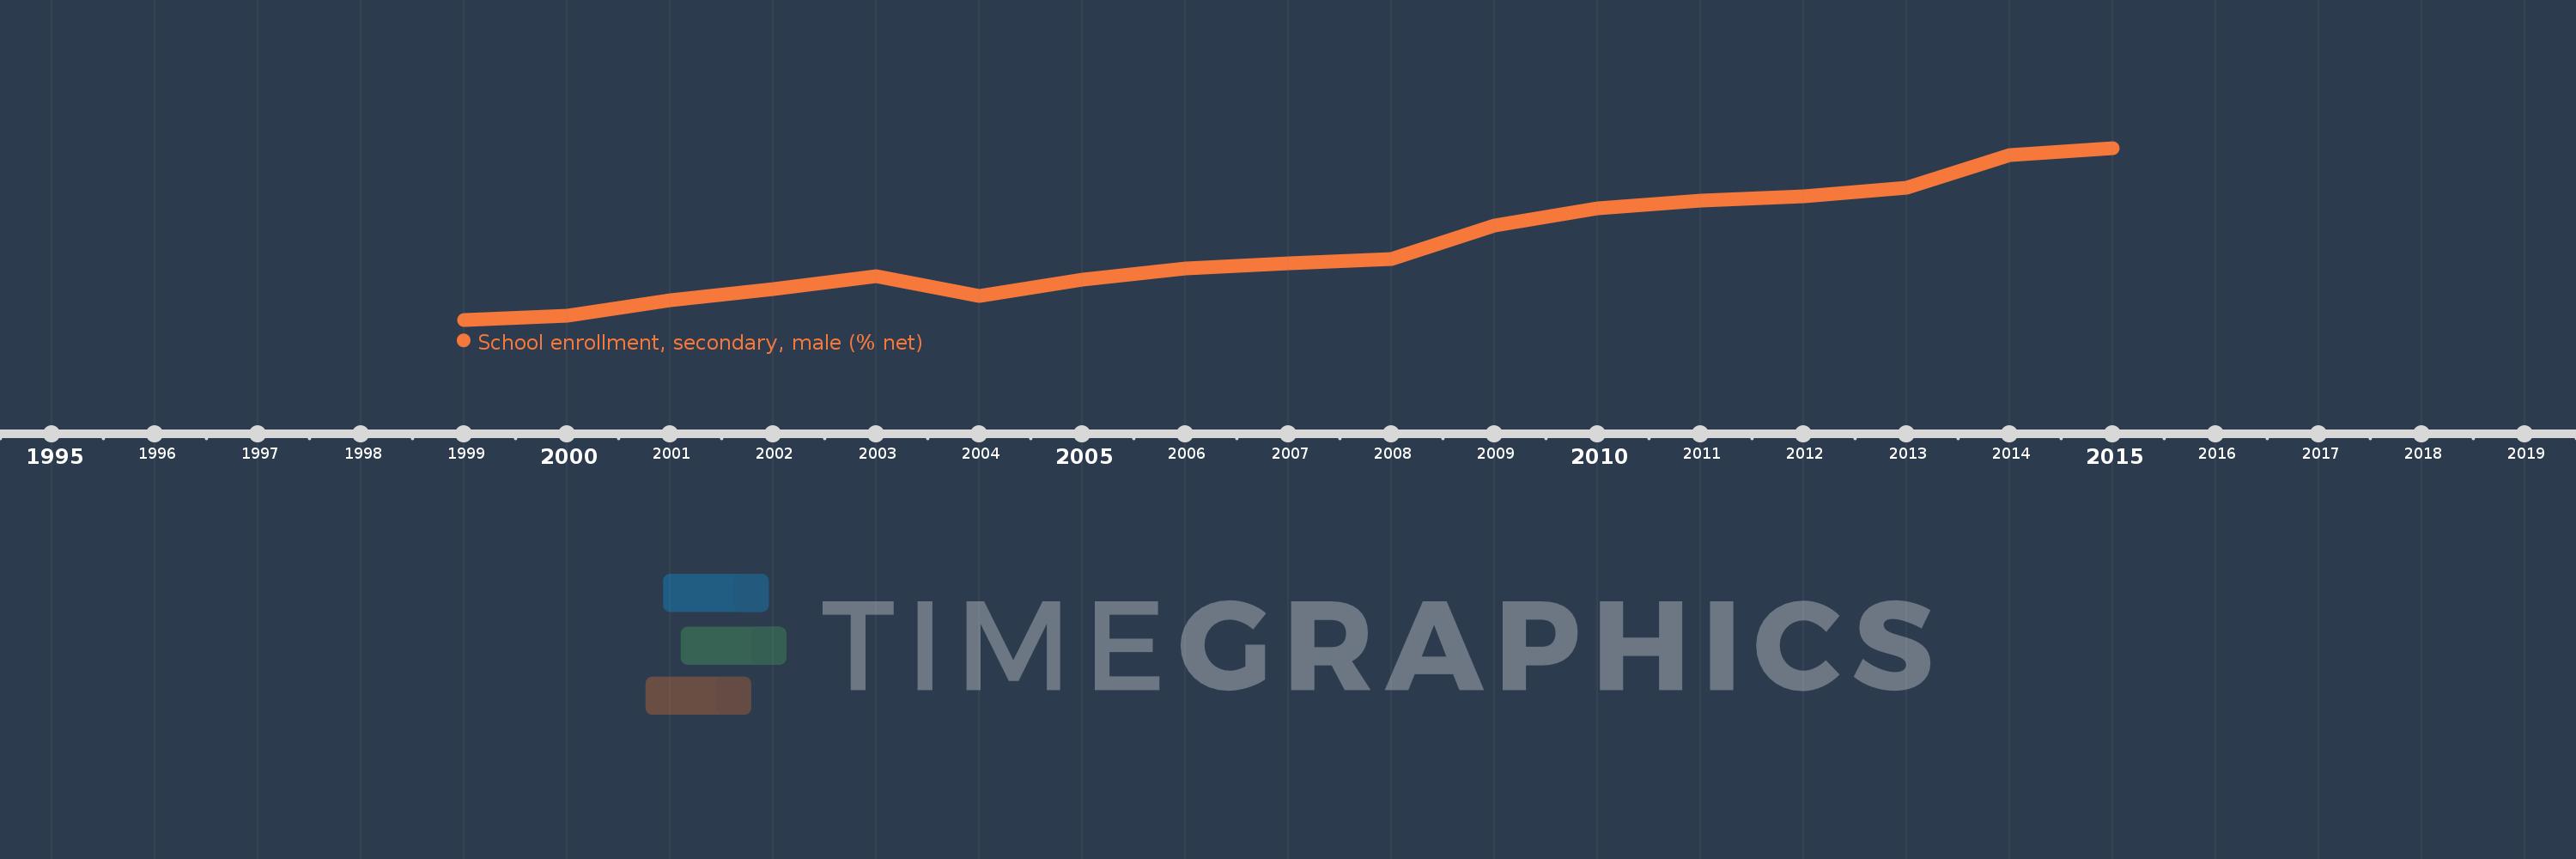
This timeline shows a graph from 1999 to 2015 of Latin America & the Caribbean (IDA & IBRD countries). No data until 1998. Number of actual observations by date: 17.
Source name:
World Development Indicators
Source organization:
United Nations Educational, Scientific, and Cultural Organization (UNESCO) Institute for Statistics.
Categories, topics:
Education, Gender
Last updated:
apr 23, 2017
Indicators value changes by year
Meaning:
66.735
Minimum:
61.665
jan 1, 1999
Maximum:
73.544
jan 1, 2015
At the date of observation
Value
Absolute change
Change from the previous value
jan 1, 1999
61.665
+61.665
0.0%
jan 1, 2000
61.967
+0.302
0.49%
jan 1, 2001
63.04
+1.073
1.73%
jan 1, 2002
63.757
+0.717
1.14%
jan 1, 2003
64.705
+0.948
1.49%
jan 1, 2004
63.309
-1.396
-2.16%
jan 1, 2005
64.417
+1.108
1.75%
jan 1, 2006
65.227
+0.809
1.26%
jan 1, 2007
65.558
+0.331
0.51%
jan 1, 2008
65.842
+0.284
0.43%
jan 1, 2009
68.162
+2.32
3.52%
jan 1, 2010
69.369
+1.207
1.77%
jan 1, 2011
69.886
+0.517
0.74%
jan 1, 2012
70.193
+0.307
0.44%
jan 1, 2013
70.812
+0.618
0.88%
jan 1, 2014
73.049
+2.237
3.16%
jan 1, 2015
73.544
+0.496
0.68%
Ranking of countries by current statistics by years
