29
/
en
AIzaSyAYiBZKx7MnpbEhh9jyipgxe19OcubqV5w
April 1, 2024
44651
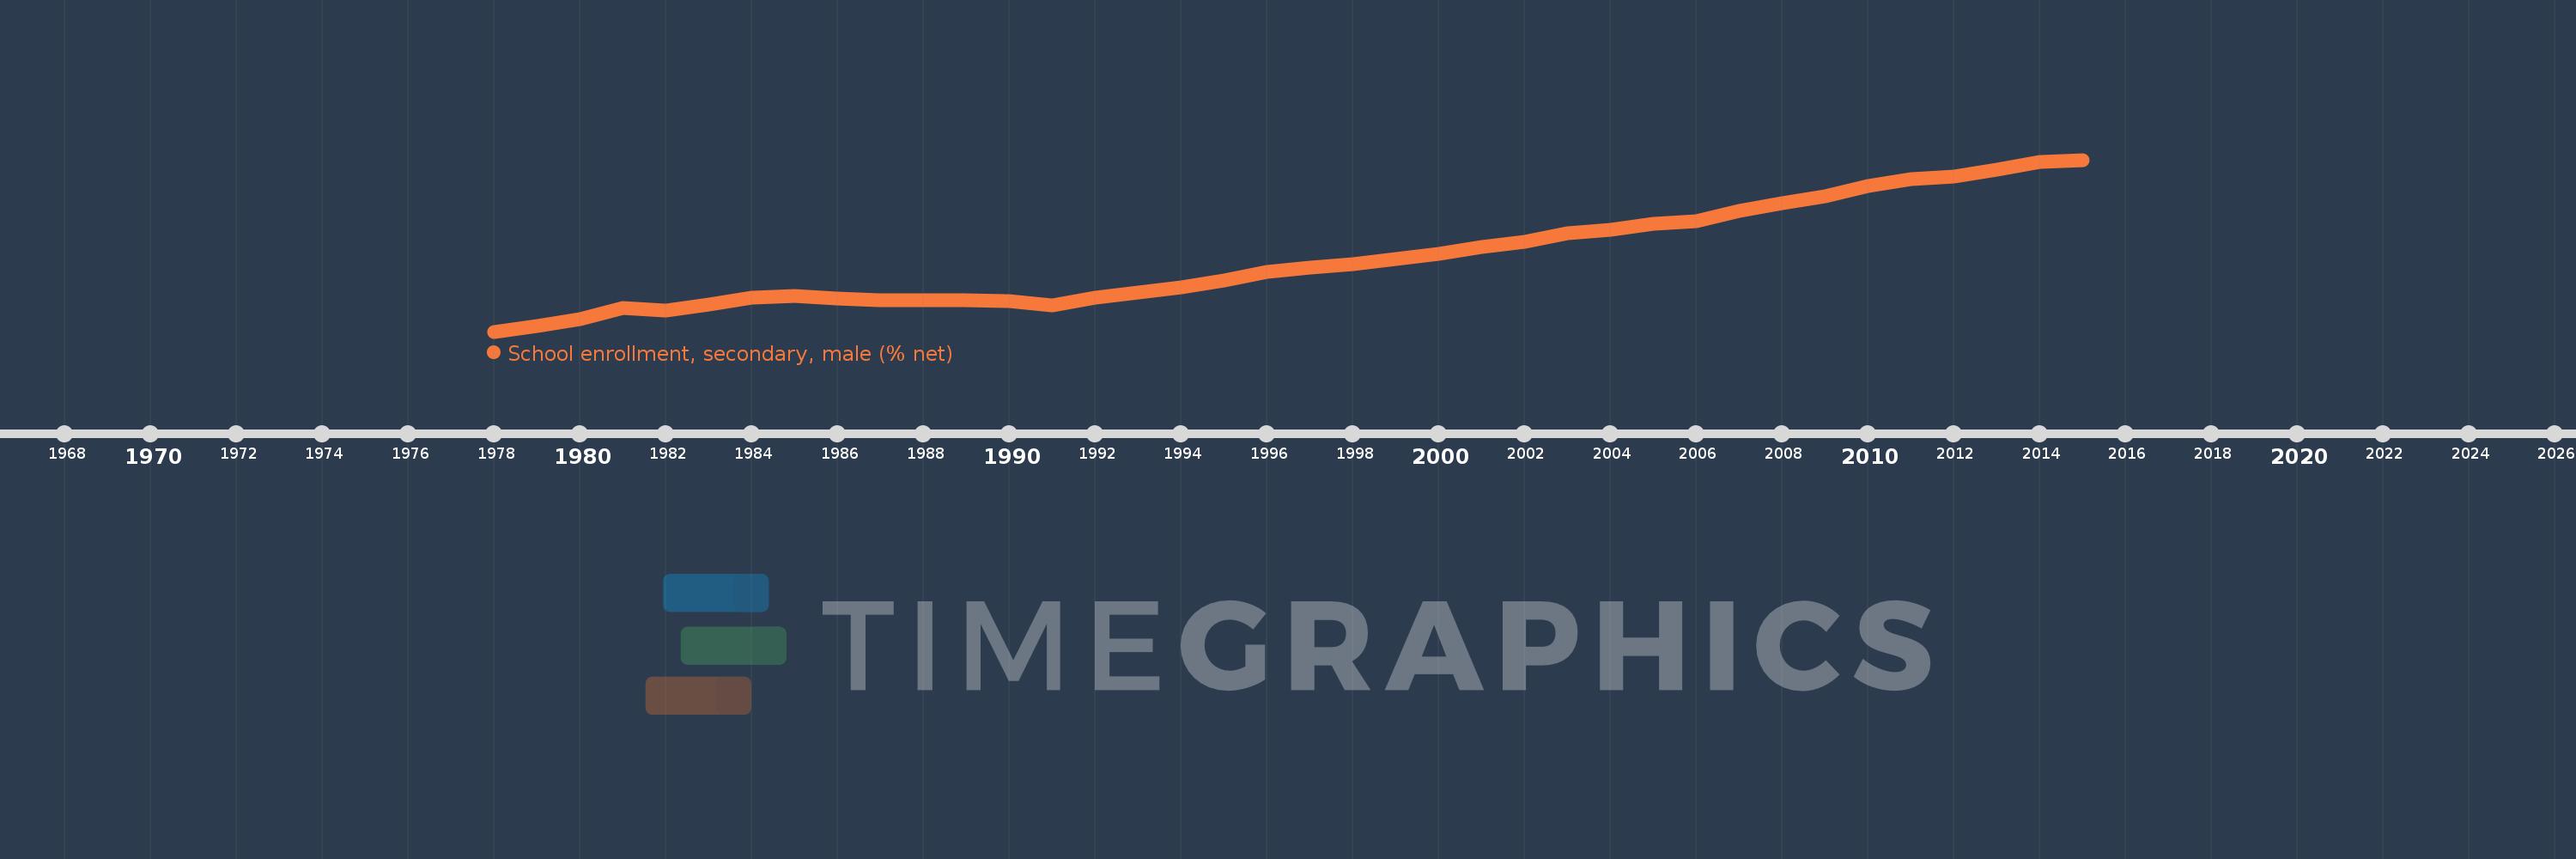
Least developed countries: UN classification
LDC
false
2
1
School enrollment, secondary, male (% net)
2015,2014,2013,2012,2011,2010,2009,2008,2007,2006,2005,2004,2003,2002,2001,2000,1999,1998,1997,1996,1995,1994,1993,1992,1991,1990,1989,1988,1987,1986,1985,1984,1983,1982,1981,1980,1979,1978
This statistics in other country:
AfghanistanAlbaniaAlgeriaAngolaAntigua and BarbudaArab WorldArgentinaArmeniaArubaAustraliaAzerbaijanBahamas, TheBahrainBangladeshBarbadosBelarusBelgiumBelizeBeninBermudaBhutanBoliviaBotswanaBrazilBrunei DarussalamBulgariaBurkina FasoBurundiCabo VerdeCambodiaCameroonCanadaCaribbean small statesCentral African RepublicCentral Europe and the BalticsChadChileColombiaComorosCongo, Dem. Rep.Congo, Rep.Costa RicaCroatiaCubaCyprusDenmarkDjiboutiDominicaDominican RepublicEarly-demographic dividendEast Asia & PacificEast Asia & Pacific (excluding high income)East Asia & Pacific (IDA & IBRD countries)EcuadorEgypt, Arab Rep.El SalvadorEquatorial GuineaEritreaEstoniaEthiopiaEuro areaEurope & Central AsiaEurope & Central Asia (excluding high income)Europe & Central Asia (IDA & IBRD countries)European UnionFijiFinlandFragile and conflict affected situationsFranceGambia, TheGeorgiaGhanaGreeceGrenadaGuatemalaGuineaGuinea-BissauGuyanaHeavily indebted poor countries (HIPC)High incomeHondurasHong Kong SAR, ChinaHungaryIBRD onlyIcelandIDA & IBRD totalIDA blendIDA onlyIDA totalIndiaIndonesiaIran, Islamic Rep.IraqIrelandIsraelItalyJamaicaJapanJordanKazakhstanKenyaKiribatiKorea, Rep.KuwaitKyrgyz RepublicLao PDRLate-demographic dividendLatin America & Caribbean Latin America & Caribbean (excluding high income)Latin America & the Caribbean (IDA & IBRD countries)LatviaLeast developed countries: UN classificationLebanonLesothoLibyaLiechtensteinLithuaniaLow & middle incomeLow incomeLower middle incomeLuxembourgMacao SAR, ChinaMacedonia, FYRMadagascarMalawiMaldivesMaliMaltaMarshall IslandsMauritaniaMauritiusMexicoMiddle East & North AfricaMiddle East & North Africa (excluding high income)Middle East & North Africa (IDA & IBRD countries)Middle incomeMoldovaMongoliaMoroccoMozambiqueMyanmarNamibiaNauruNepalNetherlandsNew ZealandNicaraguaNigerNorth AmericaNorwayOECD membersOmanOther small statesPacific island small statesPakistanPanamaParaguayPeruPhilippinesPolandPortugalPost-demographic dividendPre-demographic dividendPuerto RicoQatarRomaniaSamoaSao Tome and PrincipeSaudi ArabiaSenegalSerbiaSeychellesSierra LeoneSloveniaSmall statesSolomon IslandsSomaliaSouth AfricaSouth AsiaSouth Asia (IDA & IBRD)SpainSri LankaSt. Kitts and NevisSt. LuciaSt. Vincent and the GrenadinesSub-Saharan Africa Sub-Saharan Africa (excluding high income)Sub-Saharan Africa (IDA & IBRD countries)SurinameSwazilandSwedenSwitzerlandSyrian Arab RepublicTajikistanThailandTimor-LesteTogoTongaTrinidad and TobagoTunisiaTurkeyTuvaluUgandaUkraineUnited Arab EmiratesUnited KingdomUnited StatesUpper middle incomeUruguayVanuatuVenezuela, RBWest Bank and GazaWorldYemen, Rep.Zimbabwe Timeline:
This timeline shows a graph from 1978 to 2015 of Least developed countries: UN classification. No data until 1977. Number of actual observations by date: 38.
Source name:
World Development Indicators
Source organization:
United Nations Educational, Scientific, and Cultural Organization (UNESCO) Institute for Statistics.
Categories, topics:
Education, Gender
Last updated:
apr 23, 2017
Indicators value changes by year
Minimum:
15.248
jan 1, 1978
Maximum:
37.076
jan 1, 2015
At the date of observation
Value
Absolute change
Change from previous value
jan 1, 1978
15.248
+15.248
0.0%
jan 1, 1979
15.959
+0.711
4.67%
jan 1, 1980
16.859
+0.899
5.64%
jan 1, 1981
18.243
+1.384
8.21%
jan 1, 1982
17.942
-0.302
-1.65%
jan 1, 1983
18.723
+0.781
4.35%
jan 1, 1984
19.538
+0.815
4.36%
jan 1, 1985
19.761
+0.223
1.14%
jan 1, 1986
19.458
-0.302
-1.53%
jan 1, 1987
19.181
-0.277
-1.42%
jan 1, 1988
19.232
+0.051
0.27%
jan 1, 1989
19.231
-0.002
-0.01%
jan 1, 1990
19.077
-0.154
-0.8%
jan 1, 1991
18.579
-0.498
-2.61%
jan 1, 1992
19.557
+0.978
5.26%
jan 1, 1993
20.25
+0.693
3.55%
jan 1, 1994
20.876
+0.626
3.09%
jan 1, 1995
21.791
+0.914
4.38%
jan 1, 1996
22.833
+1.043
4.78%
jan 1, 1997
23.39
+0.557
2.44%
jan 1, 1998
23.778
+0.388
1.66%
jan 1, 1999
24.517
+0.738
3.11%
jan 1, 2000
25.13
+0.613
2.5%
jan 1, 2001
25.958
+0.829
3.3%
jan 1, 2002
26.659
+0.701
2.7%
jan 1, 2003
27.708
+1.048
3.93%
jan 1, 2004
28.175
+0.467
1.69%
jan 1, 2005
28.925
+0.75
2.66%
jan 1, 2006
29.268
+0.342
1.18%
jan 1, 2007
30.565
+1.298
4.43%
jan 1, 2008
31.546
+0.98
3.21%
jan 1, 2009
32.476
+0.93
2.95%
jan 1, 2010
33.736
+1.26
3.88%
jan 1, 2011
34.602
+0.866
2.57%
jan 1, 2012
34.951
+0.349
1.01%
jan 1, 2013
35.845
+0.894
2.56%
jan 1, 2014
36.775
+0.93
2.59%
jan 1, 2015
37.076
+0.3
0.82%
Ranking of countries by current statistics by years


Comments: