29
/
en
AIzaSyAYiBZKx7MnpbEhh9jyipgxe19OcubqV5w
April 1, 2024
178277
Lesotho
LSO
true
2
1
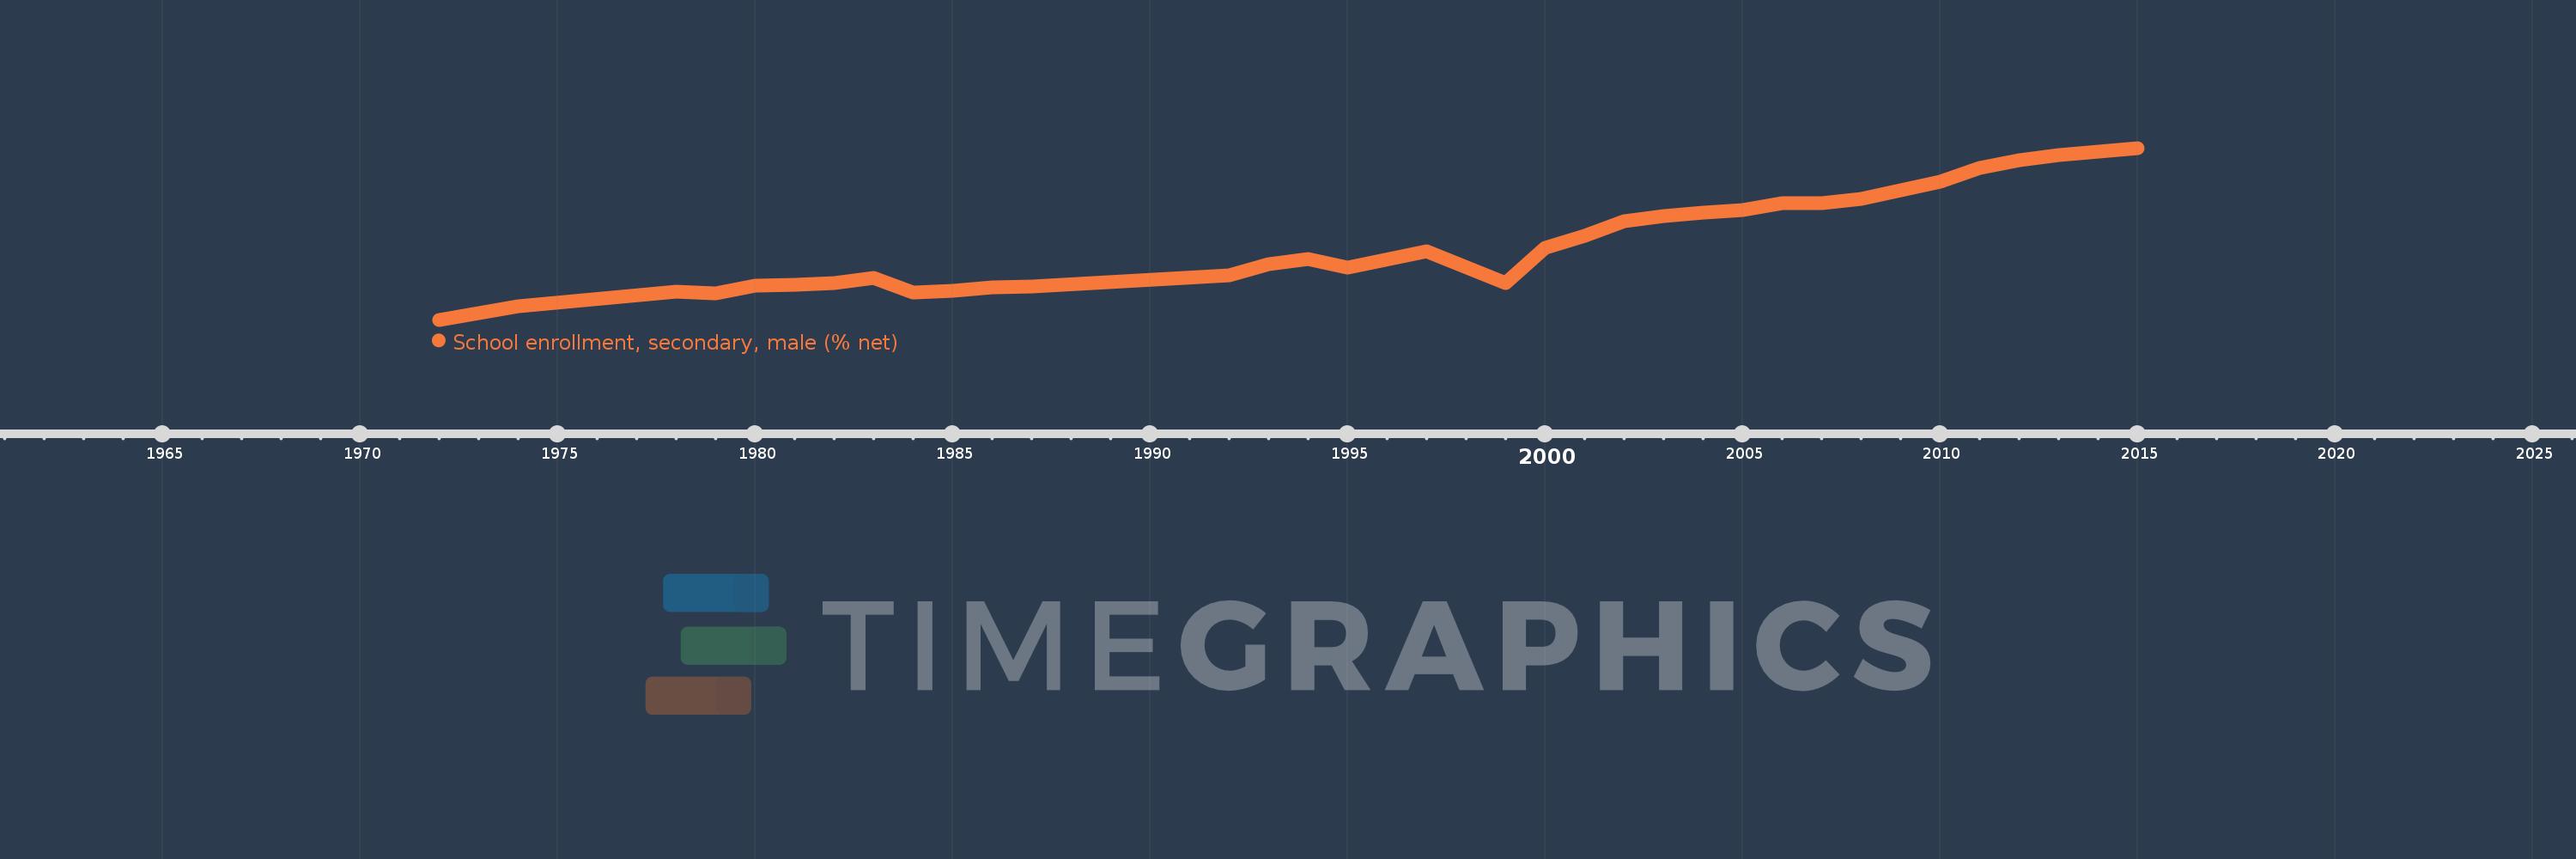
School enrollment, secondary, male (% net)
2015,2013,2012,2011,2010,2009,2008,2007,2006,2005,2004,2003,2002,2001,2000,1999,1997,1995,1994,1993,1992,1987,1986,1985,1984,1983,1982,1981,1980,1979,1978,1974,1972
This statistics in other country:
AfghanistanAlbaniaAlgeriaAngolaAntigua and BarbudaArab WorldArgentinaArmeniaArubaAustraliaAzerbaijanBahamas, TheBahrainBangladeshBarbadosBelarusBelgiumBelizeBeninBermudaBhutanBoliviaBotswanaBrazilBrunei DarussalamBulgariaBurkina FasoBurundiCabo VerdeCambodiaCameroonCanadaCaribbean small statesCentral African RepublicCentral Europe and the BalticsChadChileColombiaComorosCongo, Dem. Rep.Congo, Rep.Costa RicaCroatiaCubaCyprusDenmarkDjiboutiDominicaDominican RepublicEarly-demographic dividendEast Asia & PacificEast Asia & Pacific (excluding high income)East Asia & Pacific (IDA & IBRD countries)EcuadorEgypt, Arab Rep.El SalvadorEquatorial GuineaEritreaEstoniaEthiopiaEuro areaEurope & Central AsiaEurope & Central Asia (excluding high income)Europe & Central Asia (IDA & IBRD countries)European UnionFijiFinlandFragile and conflict affected situationsFranceGambia, TheGeorgiaGhanaGreeceGrenadaGuatemalaGuineaGuinea-BissauGuyanaHeavily indebted poor countries (HIPC)High incomeHondurasHong Kong SAR, ChinaHungaryIBRD onlyIcelandIDA & IBRD totalIDA blendIDA onlyIDA totalIndiaIndonesiaIran, Islamic Rep.IraqIrelandIsraelItalyJamaicaJapanJordanKazakhstanKenyaKiribatiKorea, Rep.KuwaitKyrgyz RepublicLao PDRLate-demographic dividendLatin America & Caribbean Latin America & Caribbean (excluding high income)Latin America & the Caribbean (IDA & IBRD countries)LatviaLeast developed countries: UN classificationLebanonLesothoLibyaLiechtensteinLithuaniaLow & middle incomeLow incomeLower middle incomeLuxembourgMacao SAR, ChinaMacedonia, FYRMadagascarMalawiMaldivesMaliMaltaMarshall IslandsMauritaniaMauritiusMexicoMiddle East & North AfricaMiddle East & North Africa (excluding high income)Middle East & North Africa (IDA & IBRD countries)Middle incomeMoldovaMongoliaMoroccoMozambiqueMyanmarNamibiaNauruNepalNetherlandsNew ZealandNicaraguaNigerNorth AmericaNorwayOECD membersOmanOther small statesPacific island small statesPakistanPanamaParaguayPeruPhilippinesPolandPortugalPost-demographic dividendPre-demographic dividendPuerto RicoQatarRomaniaSamoaSao Tome and PrincipeSaudi ArabiaSenegalSerbiaSeychellesSierra LeoneSloveniaSmall statesSolomon IslandsSomaliaSouth AfricaSouth AsiaSouth Asia (IDA & IBRD)SpainSri LankaSt. Kitts and NevisSt. LuciaSt. Vincent and the GrenadinesSub-Saharan Africa Sub-Saharan Africa (excluding high income)Sub-Saharan Africa (IDA & IBRD countries)SurinameSwazilandSwedenSwitzerlandSyrian Arab RepublicTajikistanThailandTimor-LesteTogoTongaTrinidad and TobagoTunisiaTurkeyTuvaluUgandaUkraineUnited Arab EmiratesUnited KingdomUnited StatesUpper middle incomeUruguayVanuatuVenezuela, RBWest Bank and GazaWorldYemen, Rep.Zimbabwe Timeline:
This timeline shows a graph from 1972 to 2015 of Lesotho. No data until 1971. Number of actual observations by date: 33.
Source name:
World Development Indicators
Source organization:
United Nations Educational, Scientific, and Cultural Organization (UNESCO) Institute for Statistics.
Categories, topics:
Education, Gender
Last updated:
apr 23, 2017
Indicators value changes by year
Maximum:
27.056
jan 1, 2015
At the date of observation
Value
Absolute change
Change from previous value
jan 1, 1972
3.664
+3.664
0.0%
jan 1, 1974
5.513
+1.849
50.46%
jan 1, 1978
7.437
+1.925
34.91%
jan 1, 1979
7.228
-0.21
-2.82%
jan 1, 1980
8.363
+1.135
15.7%
jan 1, 1981
8.46
+0.097
1.16%
jan 1, 1982
8.697
+0.237
2.8%
jan 1, 1983
9.387
+0.691
7.94%
jan 1, 1984
7.365
-2.022
-21.54%
jan 1, 1985
7.604
+0.239
3.24%
jan 1, 1986
8.028
+0.424
5.57%
jan 1, 1987
8.191
+0.164
2.04%
jan 1, 1992
9.666
+1.474
18.0%
jan 1, 1993
11.284
+1.618
16.74%
jan 1, 1994
11.959
+0.675
5.98%
jan 1, 1995
10.767
-1.191
-9.96%
jan 1, 1997
12.951
+2.183
20.28%
jan 1, 1999
8.71
-4.241
-32.75%
jan 1, 2000
13.396
+4.686
53.8%
jan 1, 2001
15.146
+1.75
13.07%
jan 1, 2002
17.111
+1.965
12.98%
jan 1, 2003
17.782
+0.671
3.92%
jan 1, 2004
18.22
+0.438
2.46%
jan 1, 2005
18.632
+0.412
2.26%
jan 1, 2006
19.572
+0.94
5.05%
jan 1, 2007
19.582
+0.01
0.05%
jan 1, 2008
20.155
+0.574
2.93%
jan 1, 2009
21.341
+1.186
5.88%
jan 1, 2010
22.456
+1.114
5.22%
jan 1, 2011
24.364
+1.908
8.5%
jan 1, 2012
25.364
+1.0
4.1%
jan 1, 2013
26.072
+0.709
2.79%
jan 1, 2015
27.056
+0.983
3.77%
Ranking of countries by current statistics by years


Comments: