29
/
en
AIzaSyAYiBZKx7MnpbEhh9jyipgxe19OcubqV5w
April 1, 2024
33847
European Union
EUU
false
2
1
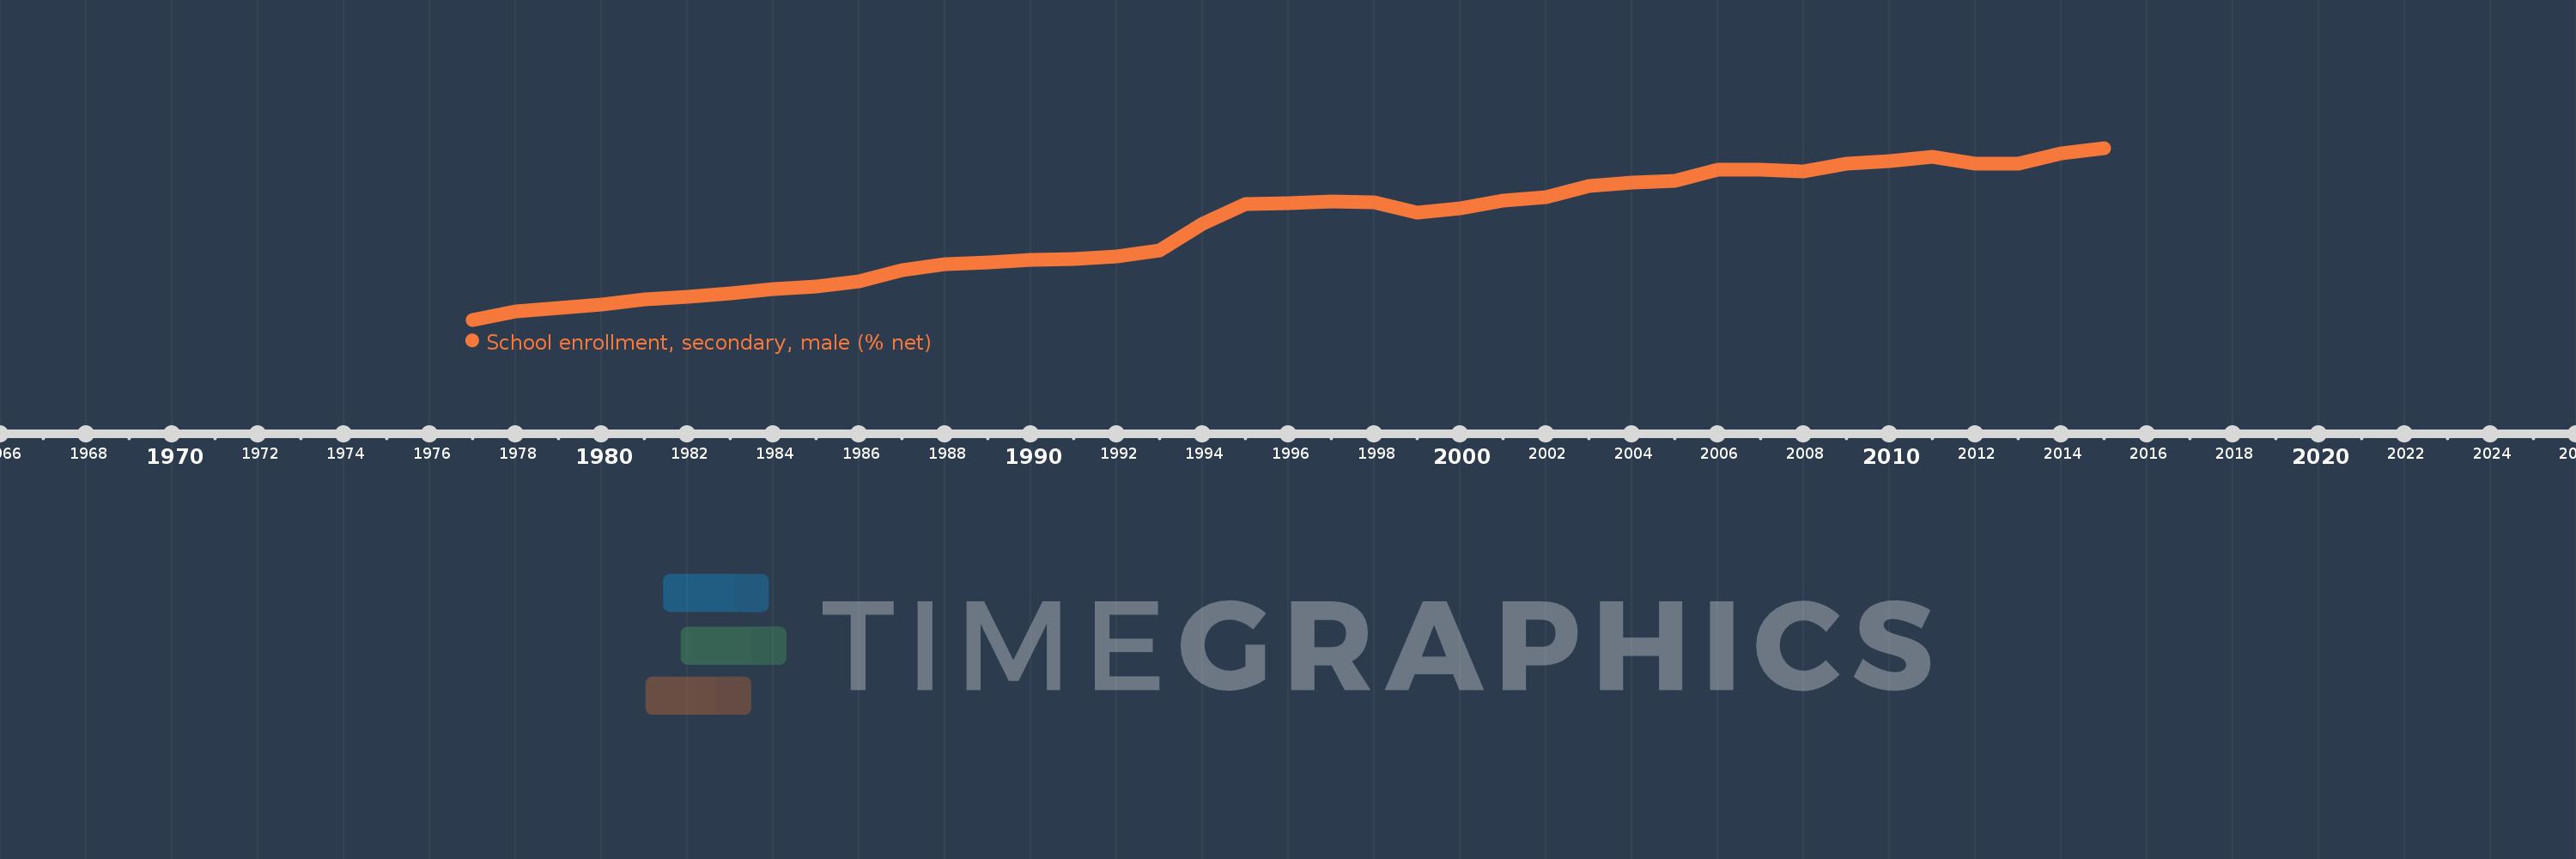
School enrollment, secondary, male (% net)
2015,2014,2013,2012,2011,2010,2009,2008,2007,2006,2005,2004,2003,2002,2001,2000,1999,1998,1997,1996,1995,1994,1993,1992,1991,1990,1989,1988,1987,1986,1985,1984,1983,1982,1981,1980,1979,1978,1977
This statistics in other country:
AfghanistanAlbaniaAlgeriaAngolaAntigua and BarbudaArab WorldArgentinaArmeniaArubaAustraliaAzerbaijanBahamas, TheBahrainBangladeshBarbadosBelarusBelgiumBelizeBeninBermudaBhutanBoliviaBotswanaBrazilBrunei DarussalamBulgariaBurkina FasoBurundiCabo VerdeCambodiaCameroonCanadaCaribbean small statesCentral African RepublicCentral Europe and the BalticsChadChileColombiaComorosCongo, Dem. Rep.Congo, Rep.Costa RicaCroatiaCubaCyprusDenmarkDjiboutiDominicaDominican RepublicEarly-demographic dividendEast Asia & PacificEast Asia & Pacific (excluding high income)East Asia & Pacific (IDA & IBRD countries)EcuadorEgypt, Arab Rep.El SalvadorEquatorial GuineaEritreaEstoniaEthiopiaEuro areaEurope & Central AsiaEurope & Central Asia (excluding high income)Europe & Central Asia (IDA & IBRD countries)European UnionFijiFinlandFragile and conflict affected situationsFranceGambia, TheGeorgiaGhanaGreeceGrenadaGuatemalaGuineaGuinea-BissauGuyanaHeavily indebted poor countries (HIPC)High incomeHondurasHong Kong SAR, ChinaHungaryIBRD onlyIcelandIDA & IBRD totalIDA blendIDA onlyIDA totalIndiaIndonesiaIran, Islamic Rep.IraqIrelandIsraelItalyJamaicaJapanJordanKazakhstanKenyaKiribatiKorea, Rep.KuwaitKyrgyz RepublicLao PDRLate-demographic dividendLatin America & Caribbean Latin America & Caribbean (excluding high income)Latin America & the Caribbean (IDA & IBRD countries)LatviaLeast developed countries: UN classificationLebanonLesothoLibyaLiechtensteinLithuaniaLow & middle incomeLow incomeLower middle incomeLuxembourgMacao SAR, ChinaMacedonia, FYRMadagascarMalawiMaldivesMaliMaltaMarshall IslandsMauritaniaMauritiusMexicoMiddle East & North AfricaMiddle East & North Africa (excluding high income)Middle East & North Africa (IDA & IBRD countries)Middle incomeMoldovaMongoliaMoroccoMozambiqueMyanmarNamibiaNauruNepalNetherlandsNew ZealandNicaraguaNigerNorth AmericaNorwayOECD membersOmanOther small statesPacific island small statesPakistanPanamaParaguayPeruPhilippinesPolandPortugalPost-demographic dividendPre-demographic dividendPuerto RicoQatarRomaniaSamoaSao Tome and PrincipeSaudi ArabiaSenegalSerbiaSeychellesSierra LeoneSloveniaSmall statesSolomon IslandsSomaliaSouth AfricaSouth AsiaSouth Asia (IDA & IBRD)SpainSri LankaSt. Kitts and NevisSt. LuciaSt. Vincent and the GrenadinesSub-Saharan Africa Sub-Saharan Africa (excluding high income)Sub-Saharan Africa (IDA & IBRD countries)SurinameSwazilandSwedenSwitzerlandSyrian Arab RepublicTajikistanThailandTimor-LesteTogoTongaTrinidad and TobagoTunisiaTurkeyTuvaluUgandaUkraineUnited Arab EmiratesUnited KingdomUnited StatesUpper middle incomeUruguayVanuatuVenezuela, RBWest Bank and GazaWorldYemen, Rep.Zimbabwe Timeline:
This timeline shows a graph from 1977 to 2015 of European Union. No data until 1976. Number of actual observations by date: 39.
Source name:
World Development Indicators
Source organization:
United Nations Educational, Scientific, and Cultural Organization (UNESCO) Institute for Statistics.
Categories, topics:
Education, Gender
Last updated:
apr 23, 2017
Indicators value changes by year
Minimum:
73.379
jan 1, 1977
Maximum:
92.168
jan 1, 2015
At the date of observation
Value
Absolute change
Change from previous value
jan 1, 1977
73.379
+73.379
0.0%
jan 1, 1978
74.306
+0.928
1.26%
jan 1, 1979
74.632
+0.326
0.44%
jan 1, 1980
75.024
+0.392
0.53%
jan 1, 1981
75.584
+0.559
0.75%
jan 1, 1982
75.885
+0.301
0.4%
jan 1, 1983
76.286
+0.401
0.53%
jan 1, 1984
76.706
+0.42
0.55%
jan 1, 1985
76.974
+0.268
0.35%
jan 1, 1986
77.592
+0.618
0.8%
jan 1, 1987
78.759
+1.167
1.5%
jan 1, 1988
79.455
+0.695
0.88%
jan 1, 1989
79.656
+0.201
0.25%
jan 1, 1990
79.947
+0.291
0.37%
jan 1, 1991
80.063
+0.116
0.15%
jan 1, 1992
80.264
+0.2
0.25%
jan 1, 1993
80.917
+0.653
0.81%
jan 1, 1994
83.901
+2.985
3.69%
jan 1, 1995
86.08
+2.178
2.6%
jan 1, 1996
86.125
+0.046
0.05%
jan 1, 1997
86.302
+0.176
0.2%
jan 1, 1998
86.234
-0.068
-0.08%
jan 1, 1999
85.06
-1.174
-1.36%
jan 1, 2000
85.573
+0.513
0.6%
jan 1, 2001
86.377
+0.805
0.94%
jan 1, 2002
86.813
+0.436
0.5%
jan 1, 2003
87.971
+1.158
1.33%
jan 1, 2004
88.345
+0.374
0.43%
jan 1, 2005
88.614
+0.269
0.3%
jan 1, 2006
89.836
+1.222
1.38%
jan 1, 2007
89.785
-0.051
-0.06%
jan 1, 2008
89.578
-0.207
-0.23%
jan 1, 2009
90.447
+0.87
0.97%
jan 1, 2010
90.707
+0.259
0.29%
jan 1, 2011
91.234
+0.527
0.58%
jan 1, 2012
90.437
-0.797
-0.87%
jan 1, 2013
90.408
-0.029
-0.03%
jan 1, 2014
91.568
+1.161
1.28%
jan 1, 2015
92.168
+0.599
0.65%
Ranking of countries by current statistics by years


Comments: