29
/
en
AIzaSyAYiBZKx7MnpbEhh9jyipgxe19OcubqV5w
April 1, 2024
49584
Middle East & North Africa (excluding high income)
MNA
false
2
1
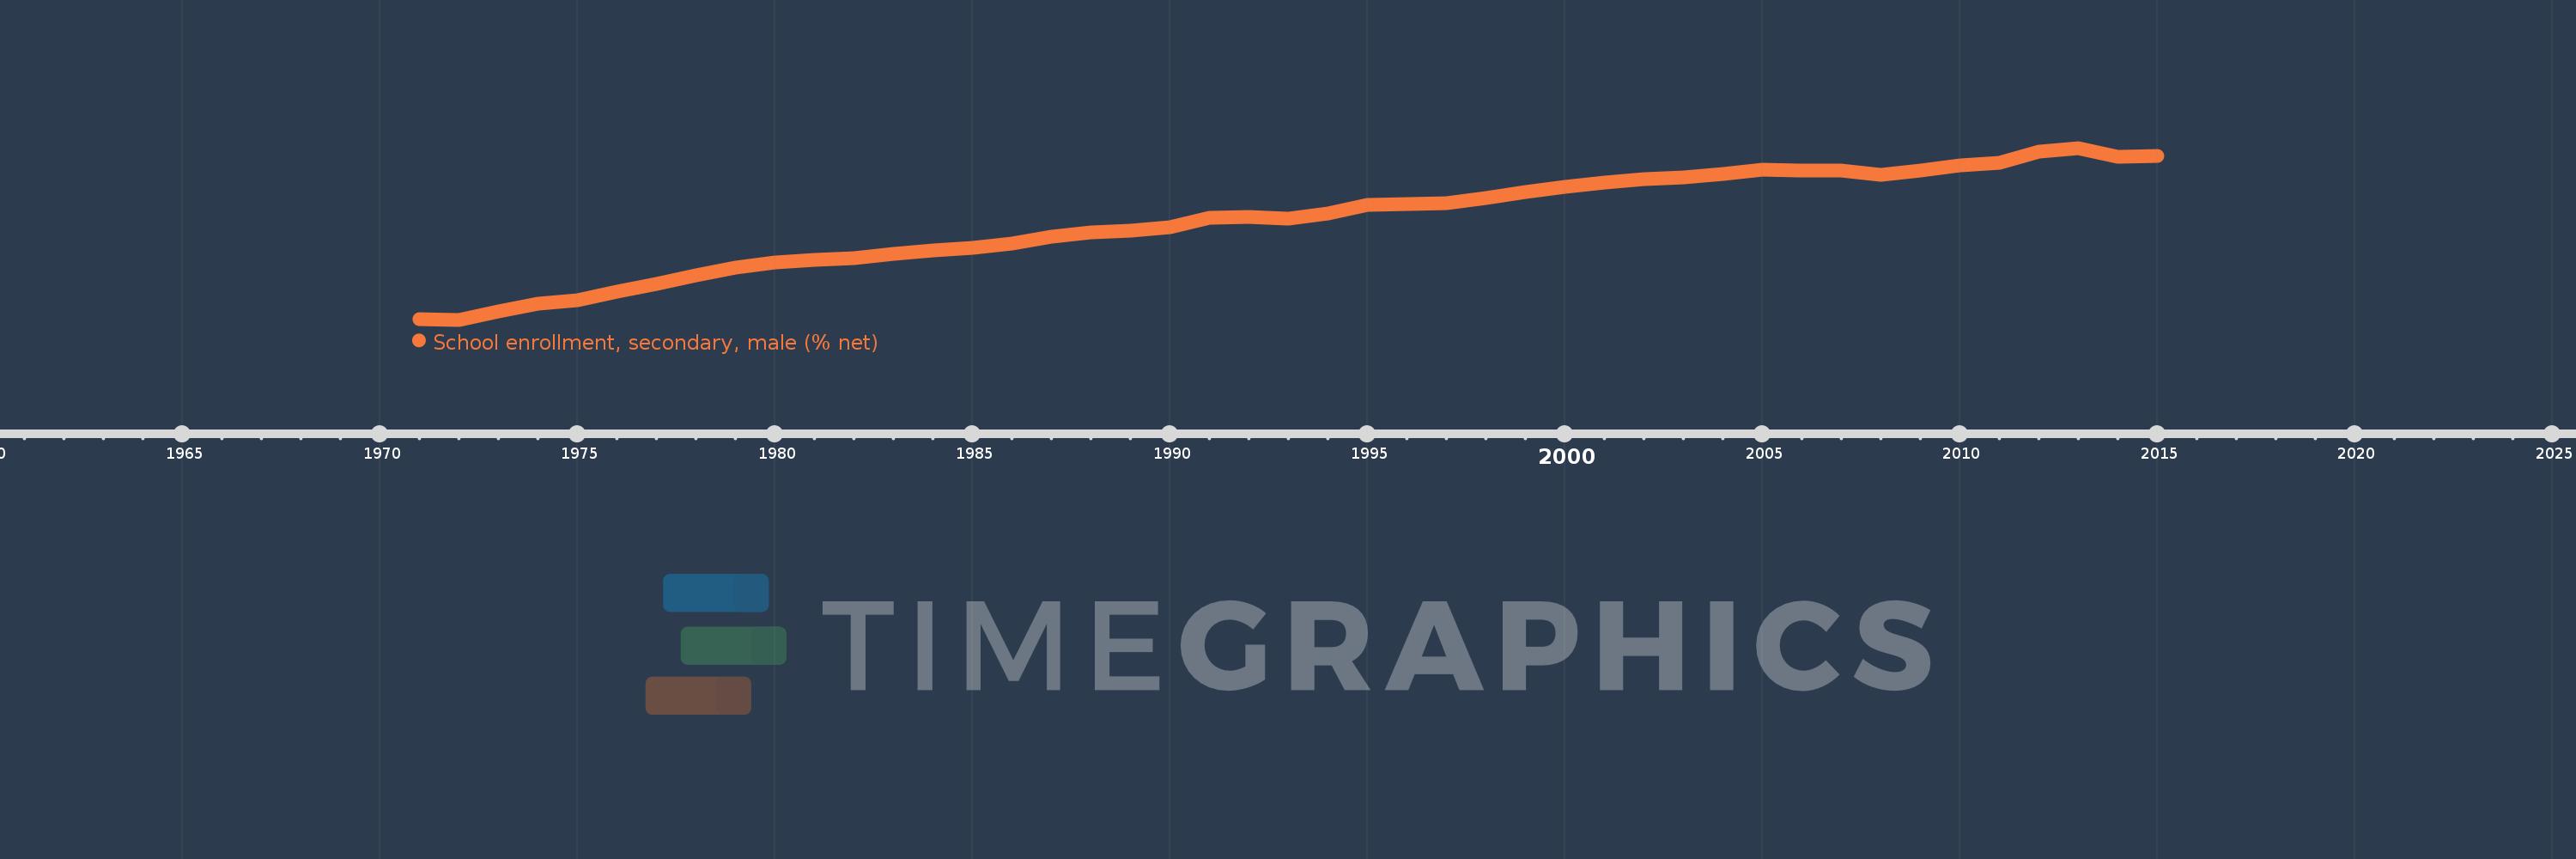
School enrollment, secondary, male (% net)
2015,2014,2013,2012,2011,2010,2009,2008,2007,2006,2005,2004,2003,2002,2001,2000,1999,1998,1997,1996,1995,1994,1993,1992,1991,1990,1989,1988,1987,1986,1985,1984,1983,1982,1981,1980,1979,1978,1977,1976,1975,1974,1973,1972,1971
This statistics in other country:
AfghanistanAlbaniaAlgeriaAngolaAntigua and BarbudaArab WorldArgentinaArmeniaArubaAustraliaAzerbaijanBahamas, TheBahrainBangladeshBarbadosBelarusBelgiumBelizeBeninBermudaBhutanBoliviaBotswanaBrazilBrunei DarussalamBulgariaBurkina FasoBurundiCabo VerdeCambodiaCameroonCanadaCaribbean small statesCentral African RepublicCentral Europe and the BalticsChadChileColombiaComorosCongo, Dem. Rep.Congo, Rep.Costa RicaCroatiaCubaCyprusDenmarkDjiboutiDominicaDominican RepublicEarly-demographic dividendEast Asia & PacificEast Asia & Pacific (excluding high income)East Asia & Pacific (IDA & IBRD countries)EcuadorEgypt, Arab Rep.El SalvadorEquatorial GuineaEritreaEstoniaEthiopiaEuro areaEurope & Central AsiaEurope & Central Asia (excluding high income)Europe & Central Asia (IDA & IBRD countries)European UnionFijiFinlandFragile and conflict affected situationsFranceGambia, TheGeorgiaGhanaGreeceGrenadaGuatemalaGuineaGuinea-BissauGuyanaHeavily indebted poor countries (HIPC)High incomeHondurasHong Kong SAR, ChinaHungaryIBRD onlyIcelandIDA & IBRD totalIDA blendIDA onlyIDA totalIndiaIndonesiaIran, Islamic Rep.IraqIrelandIsraelItalyJamaicaJapanJordanKazakhstanKenyaKiribatiKorea, Rep.KuwaitKyrgyz RepublicLao PDRLate-demographic dividendLatin America & Caribbean Latin America & Caribbean (excluding high income)Latin America & the Caribbean (IDA & IBRD countries)LatviaLeast developed countries: UN classificationLebanonLesothoLibyaLiechtensteinLithuaniaLow & middle incomeLow incomeLower middle incomeLuxembourgMacao SAR, ChinaMacedonia, FYRMadagascarMalawiMaldivesMaliMaltaMarshall IslandsMauritaniaMauritiusMexicoMiddle East & North AfricaMiddle East & North Africa (excluding high income)Middle East & North Africa (IDA & IBRD countries)Middle incomeMoldovaMongoliaMoroccoMozambiqueMyanmarNamibiaNauruNepalNetherlandsNew ZealandNicaraguaNigerNorth AmericaNorwayOECD membersOmanOther small statesPacific island small statesPakistanPanamaParaguayPeruPhilippinesPolandPortugalPost-demographic dividendPre-demographic dividendPuerto RicoQatarRomaniaSamoaSao Tome and PrincipeSaudi ArabiaSenegalSerbiaSeychellesSierra LeoneSloveniaSmall statesSolomon IslandsSomaliaSouth AfricaSouth AsiaSouth Asia (IDA & IBRD)SpainSri LankaSt. Kitts and NevisSt. LuciaSt. Vincent and the GrenadinesSub-Saharan Africa Sub-Saharan Africa (excluding high income)Sub-Saharan Africa (IDA & IBRD countries)SurinameSwazilandSwedenSwitzerlandSyrian Arab RepublicTajikistanThailandTimor-LesteTogoTongaTrinidad and TobagoTunisiaTurkeyTuvaluUgandaUkraineUnited Arab EmiratesUnited KingdomUnited StatesUpper middle incomeUruguayVanuatuVenezuela, RBWest Bank and GazaWorldYemen, Rep.Zimbabwe Timeline:
This timeline shows a graph from 1971 to 2015 of Middle East & North Africa (excluding high income). No data until 1970. Number of actual observations by date: 45.
Source name:
World Development Indicators
Source organization:
United Nations Educational, Scientific, and Cultural Organization (UNESCO) Institute for Statistics.
Categories, topics:
Education, Gender
Last updated:
apr 23, 2017
Indicators value changes by year
Minimum:
25.675
jan 1, 1972
Maximum:
73.584
jan 1, 2013
At the date of observation
Value
Absolute change
Change from previous value
jan 1, 1971
25.737
+25.737
0.0%
jan 1, 1972
25.675
-0.062
-0.24%
jan 1, 1973
27.998
+2.323
9.05%
jan 1, 1974
30.158
+2.16
7.72%
jan 1, 1975
31.195
+1.037
3.44%
jan 1, 1976
33.445
+2.25
7.21%
jan 1, 1977
35.699
+2.254
6.74%
jan 1, 1978
38.08
+2.381
6.67%
jan 1, 1979
40.207
+2.128
5.59%
jan 1, 1980
41.615
+1.407
3.5%
jan 1, 1981
42.479
+0.864
2.08%
jan 1, 1982
42.858
+0.379
0.89%
jan 1, 1983
44.136
+1.279
2.98%
jan 1, 1984
44.907
+0.771
1.75%
jan 1, 1985
45.792
+0.885
1.97%
jan 1, 1986
46.876
+1.084
2.37%
jan 1, 1987
48.848
+1.972
4.21%
jan 1, 1988
50.086
+1.238
2.53%
jan 1, 1989
50.506
+0.421
0.84%
jan 1, 1990
51.415
+0.908
1.8%
jan 1, 1991
54.063
+2.648
5.15%
jan 1, 1992
54.308
+0.246
0.45%
jan 1, 1993
53.916
-0.392
-0.72%
jan 1, 1994
55.246
+1.33
2.47%
jan 1, 1995
57.702
+2.456
4.45%
jan 1, 1996
58.029
+0.327
0.57%
jan 1, 1997
58.263
+0.234
0.4%
jan 1, 1998
59.57
+1.307
2.24%
jan 1, 1999
61.213
+1.643
2.76%
jan 1, 2000
62.772
+1.559
2.55%
jan 1, 2001
63.923
+1.151
1.83%
jan 1, 2002
64.804
+0.881
1.38%
jan 1, 2003
65.389
+0.585
0.9%
jan 1, 2004
66.334
+0.945
1.44%
jan 1, 2005
67.556
+1.223
1.84%
jan 1, 2006
67.227
-0.329
-0.49%
jan 1, 2007
67.375
+0.147
0.22%
jan 1, 2008
66.206
-1.169
-1.73%
jan 1, 2009
67.223
+1.018
1.54%
jan 1, 2010
68.742
+1.519
2.26%
jan 1, 2011
69.486
+0.744
1.08%
jan 1, 2012
72.479
+2.993
4.31%
jan 1, 2013
73.584
+1.105
1.52%
jan 1, 2014
71.155
-2.428
-3.3%
jan 1, 2015
71.445
+0.29
0.41%
Ranking of countries by current statistics by years


Comments: