29
/
en
AIzaSyAYiBZKx7MnpbEhh9jyipgxe19OcubqV5w
April 1, 2024
214777
Norway
NOR
true
2
1
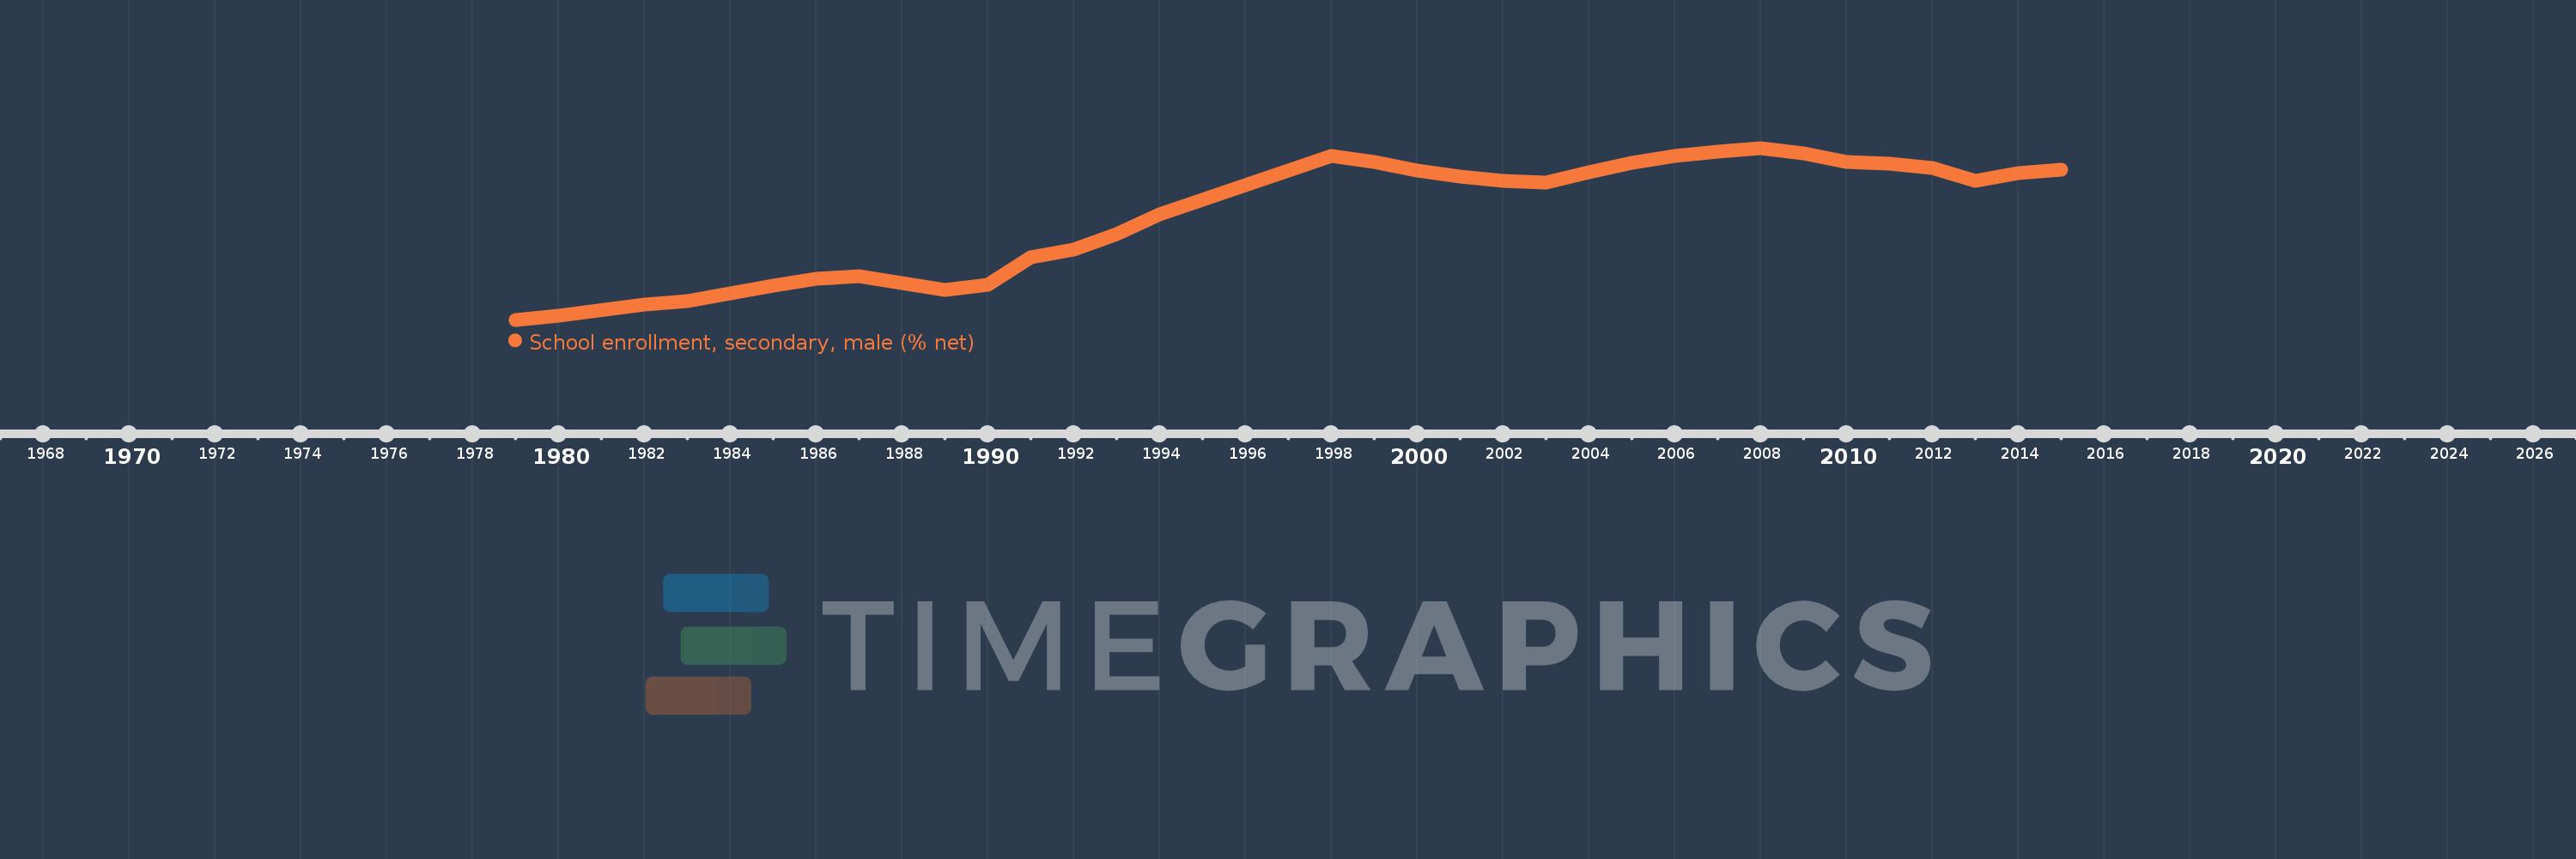
School enrollment, secondary, male (% net)
2015,2014,2013,2012,2011,2010,2009,2008,2007,2006,2005,2004,2003,2002,2001,2000,1999,1998,1994,1993,1992,1991,1990,1989,1988,1987,1986,1985,1983,1982,1980,1979
This statistics in other country:
AfghanistanAlbaniaAlgeriaAngolaAntigua and BarbudaArab WorldArgentinaArmeniaArubaAustraliaAzerbaijanBahamas, TheBahrainBangladeshBarbadosBelarusBelgiumBelizeBeninBermudaBhutanBoliviaBotswanaBrazilBrunei DarussalamBulgariaBurkina FasoBurundiCabo VerdeCambodiaCameroonCanadaCaribbean small statesCentral African RepublicCentral Europe and the BalticsChadChileColombiaComorosCongo, Dem. Rep.Congo, Rep.Costa RicaCroatiaCubaCyprusDenmarkDjiboutiDominicaDominican RepublicEarly-demographic dividendEast Asia & PacificEast Asia & Pacific (excluding high income)East Asia & Pacific (IDA & IBRD countries)EcuadorEgypt, Arab Rep.El SalvadorEquatorial GuineaEritreaEstoniaEthiopiaEuro areaEurope & Central AsiaEurope & Central Asia (excluding high income)Europe & Central Asia (IDA & IBRD countries)European UnionFijiFinlandFragile and conflict affected situationsFranceGambia, TheGeorgiaGhanaGreeceGrenadaGuatemalaGuineaGuinea-BissauGuyanaHeavily indebted poor countries (HIPC)High incomeHondurasHong Kong SAR, ChinaHungaryIBRD onlyIcelandIDA & IBRD totalIDA blendIDA onlyIDA totalIndiaIndonesiaIran, Islamic Rep.IraqIrelandIsraelItalyJamaicaJapanJordanKazakhstanKenyaKiribatiKorea, Rep.KuwaitKyrgyz RepublicLao PDRLate-demographic dividendLatin America & Caribbean Latin America & Caribbean (excluding high income)Latin America & the Caribbean (IDA & IBRD countries)LatviaLeast developed countries: UN classificationLebanonLesothoLibyaLiechtensteinLithuaniaLow & middle incomeLow incomeLower middle incomeLuxembourgMacao SAR, ChinaMacedonia, FYRMadagascarMalawiMaldivesMaliMaltaMarshall IslandsMauritaniaMauritiusMexicoMiddle East & North AfricaMiddle East & North Africa (excluding high income)Middle East & North Africa (IDA & IBRD countries)Middle incomeMoldovaMongoliaMoroccoMozambiqueMyanmarNamibiaNauruNepalNetherlandsNew ZealandNicaraguaNigerNorth AmericaNorwayOECD membersOmanOther small statesPacific island small statesPakistanPanamaParaguayPeruPhilippinesPolandPortugalPost-demographic dividendPre-demographic dividendPuerto RicoQatarRomaniaSamoaSao Tome and PrincipeSaudi ArabiaSenegalSerbiaSeychellesSierra LeoneSloveniaSmall statesSolomon IslandsSomaliaSouth AfricaSouth AsiaSouth Asia (IDA & IBRD)SpainSri LankaSt. Kitts and NevisSt. LuciaSt. Vincent and the GrenadinesSub-Saharan Africa Sub-Saharan Africa (excluding high income)Sub-Saharan Africa (IDA & IBRD countries)SurinameSwazilandSwedenSwitzerlandSyrian Arab RepublicTajikistanThailandTimor-LesteTogoTongaTrinidad and TobagoTunisiaTurkeyTuvaluUgandaUkraineUnited Arab EmiratesUnited KingdomUnited StatesUpper middle incomeUruguayVanuatuVenezuela, RBWest Bank and GazaWorldYemen, Rep.Zimbabwe Timeline:
This timeline shows a graph from 1979 to 2015 of Norway. No data until 1978. Number of actual observations by date: 32.
Source name:
World Development Indicators
Source organization:
United Nations Educational, Scientific, and Cultural Organization (UNESCO) Institute for Statistics.
Categories, topics:
Education, Gender
Last updated:
apr 23, 2017
Indicators value changes by year
Minimum:
80.094
jan 1, 1979
Maximum:
97.211
jan 1, 2008
At the date of observation
Value
Absolute change
Change from previous value
jan 1, 1979
80.094
+80.094
0.0%
jan 1, 1980
80.518
+0.424
0.53%
jan 1, 1982
81.618
+1.1
1.37%
jan 1, 1983
81.942
+0.324
0.4%
jan 1, 1985
83.463
+1.521
1.86%
jan 1, 1986
84.192
+0.729
0.87%
jan 1, 1987
84.411
+0.219
0.26%
jan 1, 1988
83.741
-0.67
-0.79%
jan 1, 1989
83.059
-0.682
-0.81%
jan 1, 1990
83.565
+0.506
0.61%
jan 1, 1991
86.325
+2.76
3.3%
jan 1, 1992
87.06
+0.735
0.85%
jan 1, 1993
88.65
+1.59
1.83%
jan 1, 1994
90.629
+1.979
2.23%
jan 1, 1998
96.39
+5.761
6.36%
jan 1, 1999
95.813
-0.577
-0.6%
jan 1, 2000
94.924
-0.889
-0.93%
jan 1, 2001
94.335
-0.589
-0.62%
jan 1, 2002
93.967
-0.368
-0.39%
jan 1, 2003
93.72
-0.247
-0.26%
jan 1, 2004
94.767
+1.047
1.12%
jan 1, 2005
95.73
+0.963
1.02%
jan 1, 2006
96.436
+0.706
0.74%
jan 1, 2007
96.834
+0.397
0.41%
jan 1, 2008
97.211
+0.377
0.39%
jan 1, 2009
96.64
-0.571
-0.59%
jan 1, 2010
95.823
-0.817
-0.85%
jan 1, 2011
95.624
-0.199
-0.21%
jan 1, 2012
95.241
-0.383
-0.4%
jan 1, 2013
93.908
-1.333
-1.4%
jan 1, 2014
94.688
+0.78
0.83%
jan 1, 2015
95.011
+0.323
0.34%
Ranking of countries by current statistics by years


Comments: