29
/
en
AIzaSyAYiBZKx7MnpbEhh9jyipgxe19OcubqV5w
April 1, 2024
33141
Europe & Central Asia (IDA & IBRD countries)
TEC
false
2
1
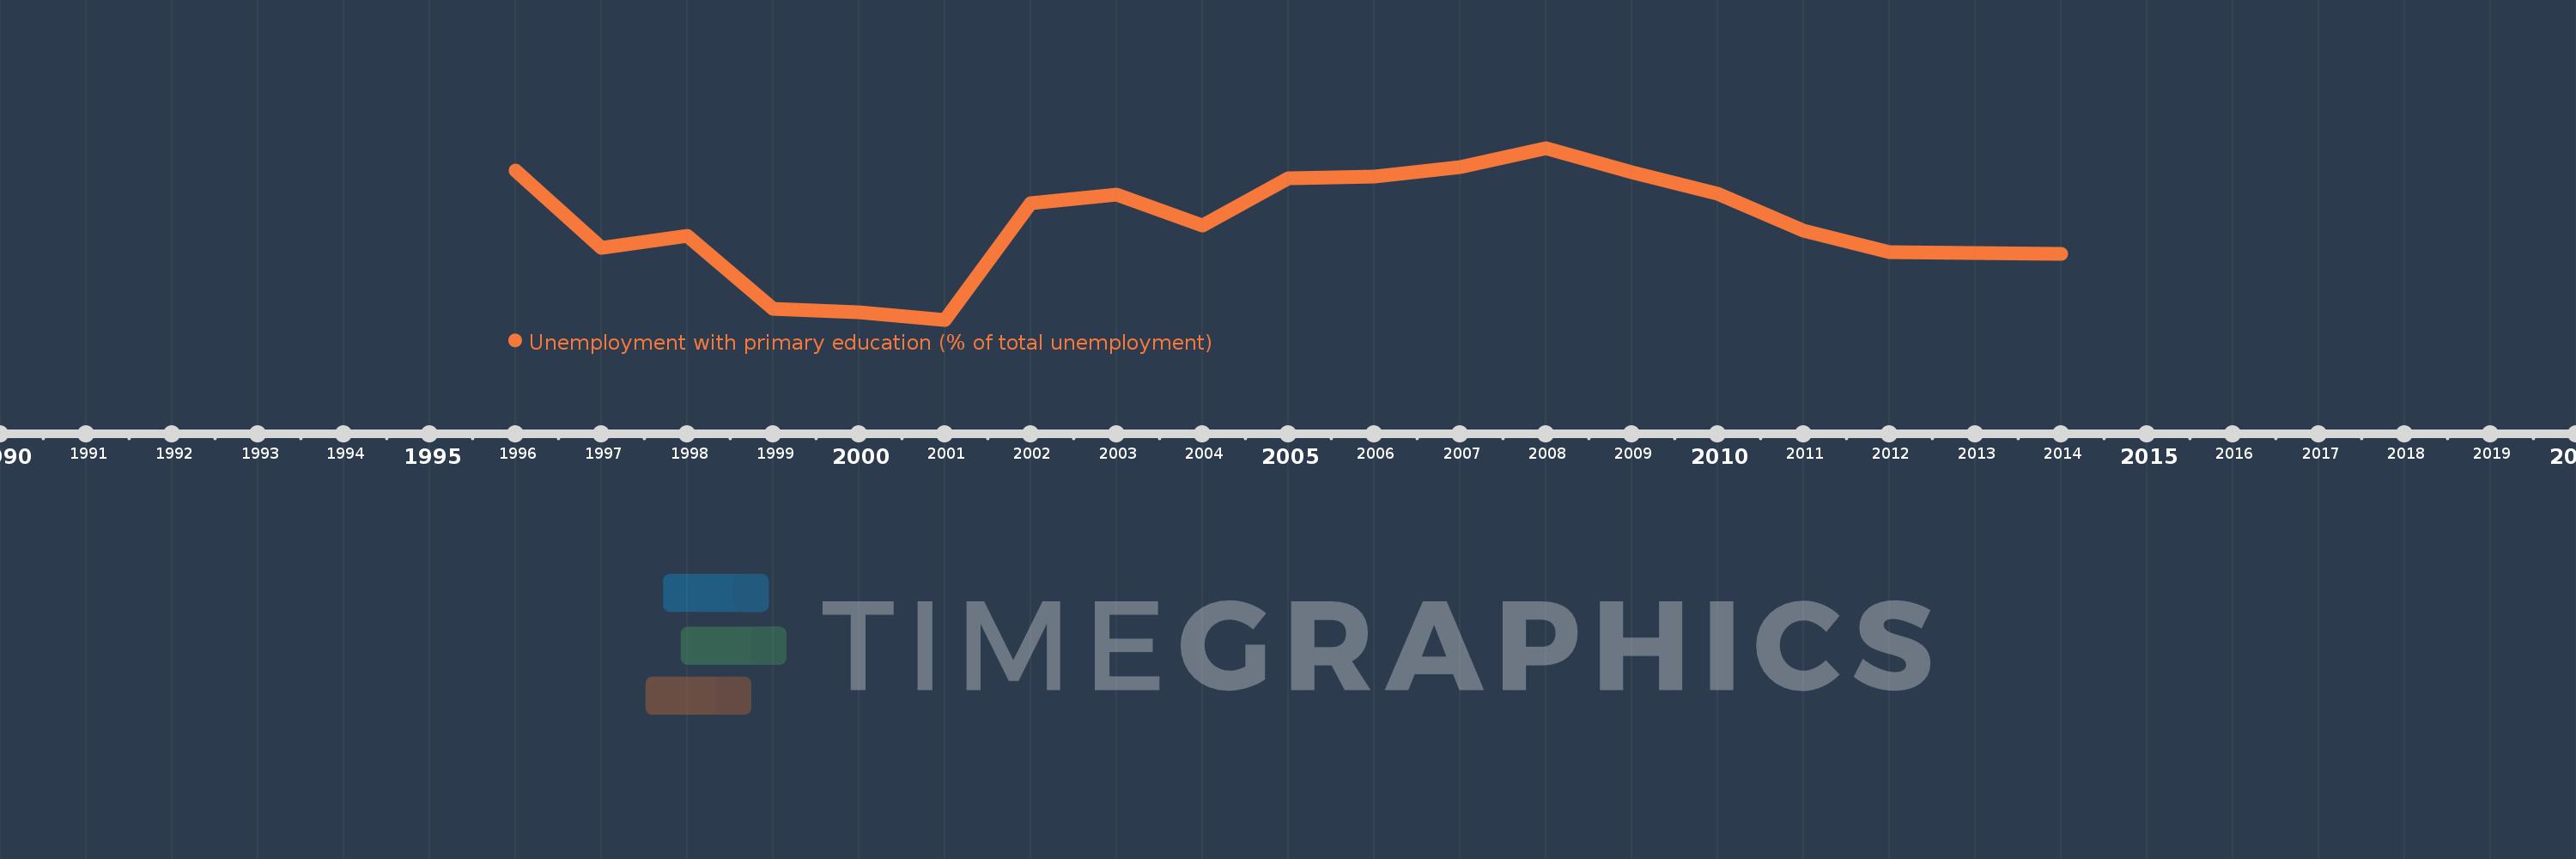
Unemployment with primary education (% of total unemployment)
2014,2012,2011,2010,2009,2008,2007,2006,2005,2004,2003,2002,2001,2000,1999,1998,1997,1996
This statistics in other country:
Timeline:
This timeline shows a graph from 1996 to 2014 of Europe & Central Asia (IDA & IBRD countries). No data until 1995. Number of actual observations by date: 18.
Source name:
World Development Indicators
Source organization:
International Labour Organization, Key Indicators of the Labour Market database.
Categories, topics:
Social Protection & Labor
Last updated:
apr 23, 2017
Indicators value changes by year
Minimum:
19.531
jan 1, 2001
Maximum:
23.875
jan 1, 2008
At the date of observation
Value
Absolute change
Change from previous value
jan 1, 1996
23.312
+23.312
0.0%
jan 1, 1997
21.344
-1.968
-8.44%
jan 1, 1998
21.657
+0.312
1.46%
jan 1, 1999
19.804
-1.852
-8.55%
jan 1, 2000
19.717
-0.088
-0.44%
jan 1, 2001
19.531
-0.186
-0.94%
jan 1, 2002
22.47
+2.939
15.05%
jan 1, 2003
22.689
+0.219
0.98%
jan 1, 2004
21.905
-0.784
-3.46%
jan 1, 2005
23.116
+1.211
5.53%
jan 1, 2006
23.158
+0.042
0.18%
jan 1, 2007
23.38
+0.222
0.96%
jan 1, 2008
23.875
+0.495
2.12%
jan 1, 2009
23.262
-0.613
-2.57%
jan 1, 2010
22.72
-0.542
-2.33%
jan 1, 2011
21.786
-0.934
-4.11%
jan 1, 2012
21.242
-0.544
-2.5%
jan 1, 2014
21.193
-0.049
-0.23%
Ranking of countries by current statistics by years


Comments: