29
/
en
AIzaSyAYiBZKx7MnpbEhh9jyipgxe19OcubqV5w
April 1, 2024
53135
OECD members
OED
false
2
1
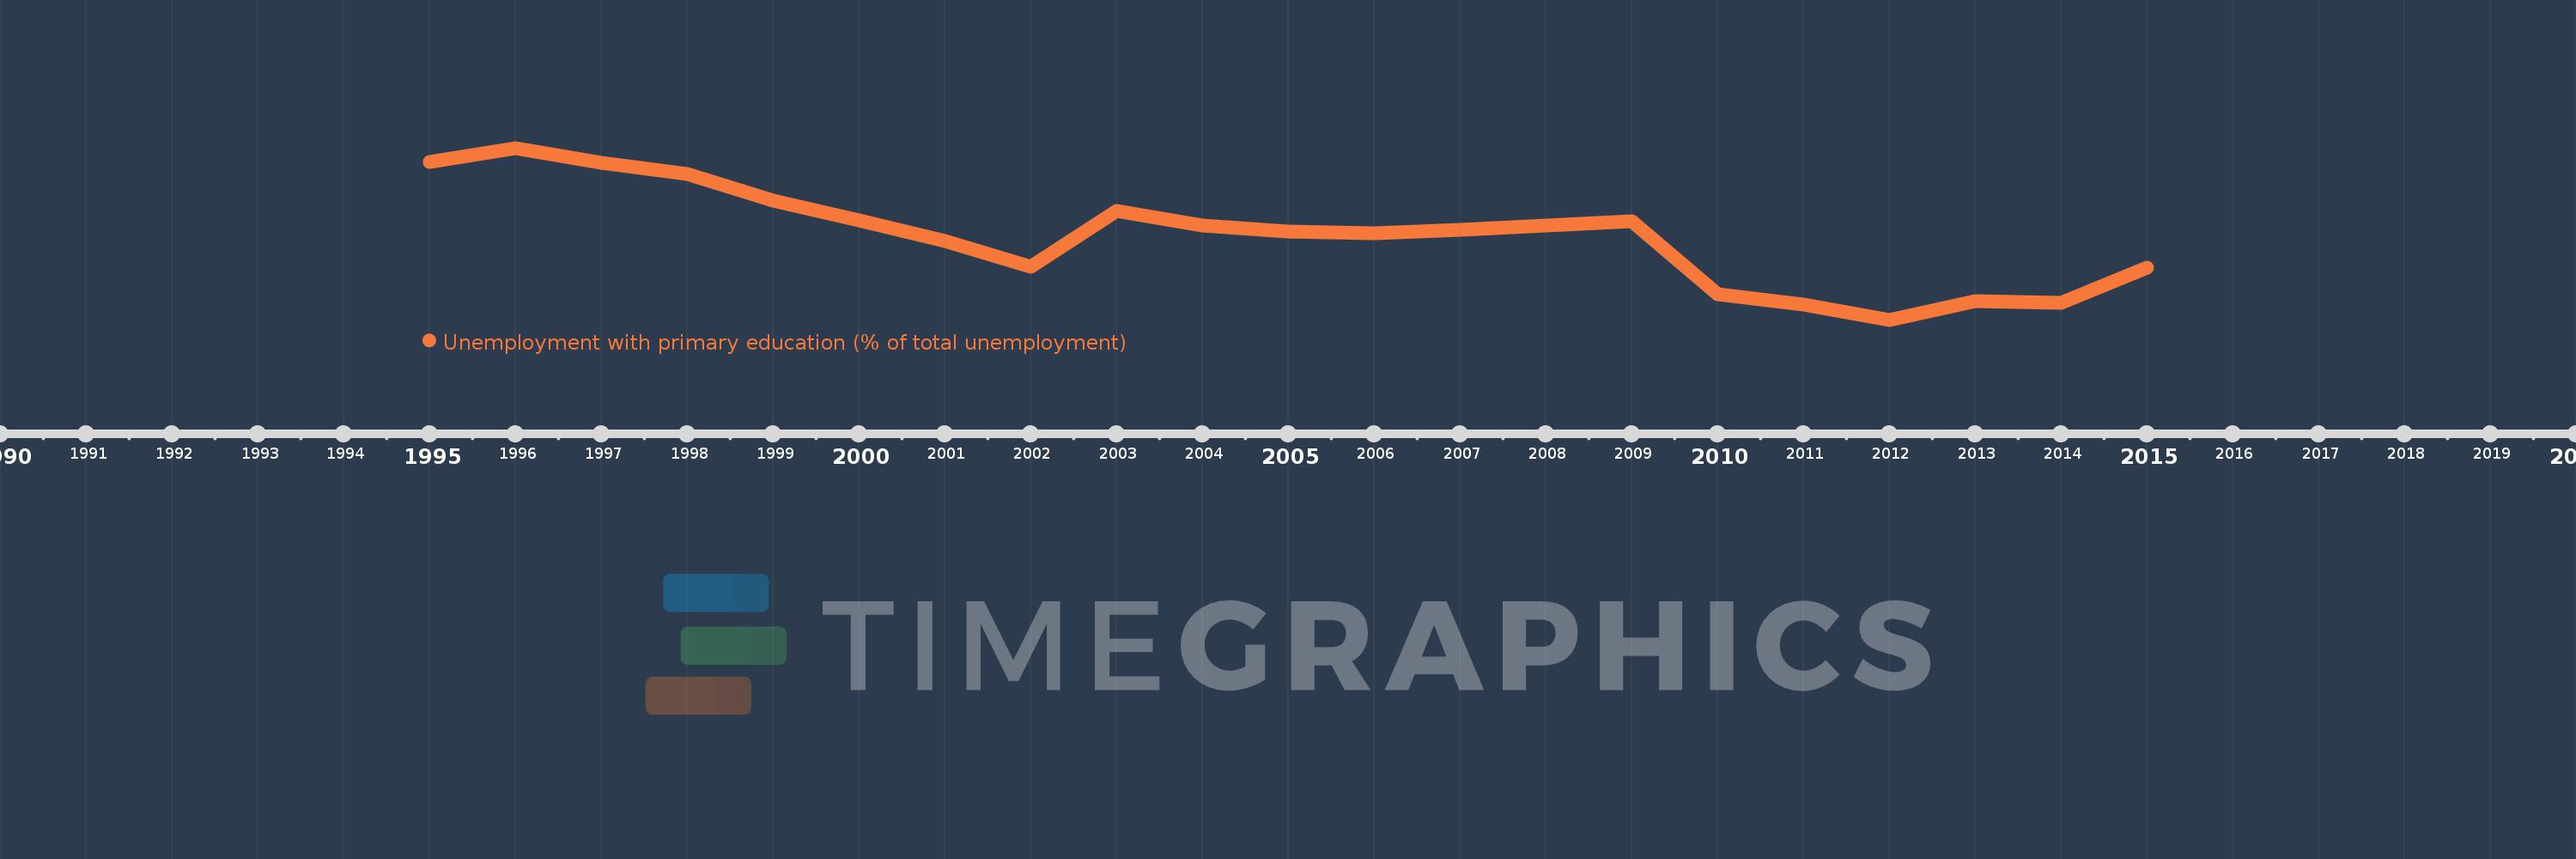
Unemployment with primary education (% of total unemployment)
2015,2014,2013,2012,2011,2010,2009,2008,2007,2006,2005,2004,2003,2002,2001,2000,1999,1998,1997,1996,1995
This statistics in other country:
Timeline:
This timeline shows a graph from 1995 to 2015 of OECD members. No data until 1994. Number of actual observations by date: 21.
Source name:
World Development Indicators
Source organization:
International Labour Organization, Key Indicators of the Labour Market database.
Categories, topics:
Social Protection & Labor
Last updated:
apr 23, 2017
Indicators value changes by year
Minimum:
28.849
jan 1, 2012
Maximum:
40.277
jan 1, 1996
At the date of observation
Value
Absolute change
Change from previous value
jan 1, 1995
39.345
+39.345
0.0%
jan 1, 1996
40.277
+0.932
2.37%
jan 1, 1997
39.272
-1.006
-2.5%
jan 1, 1998
38.527
-0.745
-1.9%
jan 1, 1999
36.771
-1.756
-4.56%
jan 1, 2000
35.44
-1.331
-3.62%
jan 1, 2001
34.115
-1.325
-3.74%
jan 1, 2002
32.397
-1.718
-5.04%
jan 1, 2003
36.104
+3.707
11.44%
jan 1, 2004
35.094
-1.011
-2.8%
jan 1, 2005
34.694
-0.4
-1.14%
jan 1, 2006
34.595
-0.098
-0.28%
jan 1, 2007
34.808
+0.213
0.62%
jan 1, 2008
35.131
+0.323
0.93%
jan 1, 2009
35.381
+0.25
0.71%
jan 1, 2010
30.54
-4.841
-13.68%
jan 1, 2011
29.84
-0.7
-2.29%
jan 1, 2012
28.849
-0.99
-3.32%
jan 1, 2013
30.069
+1.22
4.23%
jan 1, 2014
29.973
-0.097
-0.32%
jan 1, 2015
32.294
+2.321
7.74%
Ranking of countries by current statistics by years


Comments: