29
/
en
AIzaSyAYiBZKx7MnpbEhh9jyipgxe19OcubqV5w
April 1, 2024
26210
Central Europe and the Baltics
CEB
false
2
1
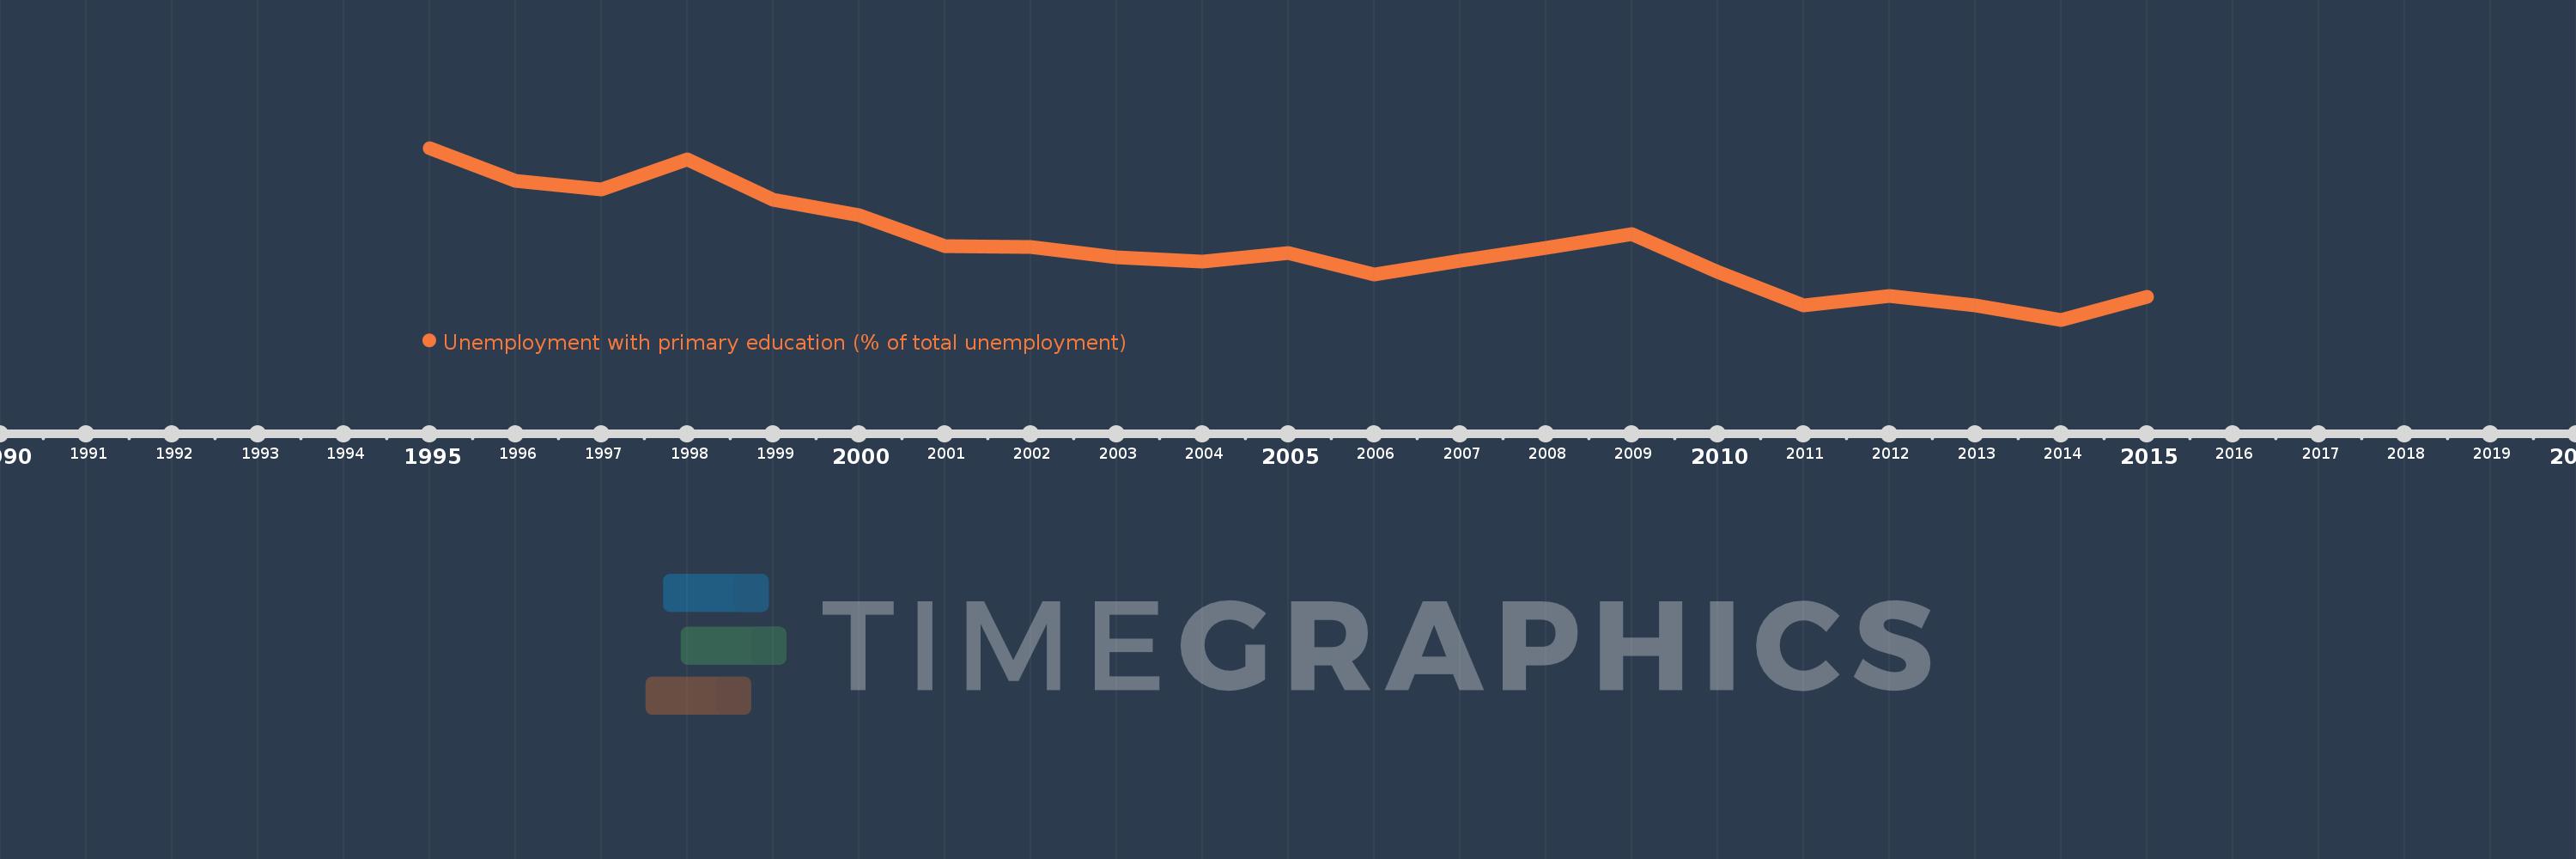
Unemployment with primary education (% of total unemployment)
2015,2014,2013,2012,2011,2010,2009,2008,2007,2006,2005,2004,2003,2002,2001,2000,1999,1998,1997,1996,1995
This statistics in other country:
Timeline:
This timeline shows a graph from 1995 to 2015 of Central Europe and the Baltics. No data until 1994. Number of actual observations by date: 21.
Source name:
World Development Indicators
Source organization:
International Labour Organization, Key Indicators of the Labour Market database.
Categories, topics:
Social Protection & Labor
Last updated:
apr 23, 2017
Indicators value changes by year
Minimum:
18.524
jan 1, 2014
Maximum:
29.042
jan 1, 1995
At the date of observation
Value
Absolute change
Change from previous value
jan 1, 1995
29.042
+29.042
0.0%
jan 1, 1996
27.051
-1.992
-6.86%
jan 1, 1997
26.492
-0.558
-2.06%
jan 1, 1998
28.332
+1.84
6.94%
jan 1, 1999
25.861
-2.471
-8.72%
jan 1, 2000
24.948
-0.913
-3.53%
jan 1, 2001
23.017
-1.931
-7.74%
jan 1, 2002
23.004
-0.013
-0.06%
jan 1, 2003
22.35
-0.654
-2.84%
jan 1, 2004
22.101
-0.249
-1.11%
jan 1, 2005
22.603
+0.501
2.27%
jan 1, 2006
21.317
-1.286
-5.69%
jan 1, 2007
22.133
+0.816
3.83%
jan 1, 2008
22.925
+0.793
3.58%
jan 1, 2009
23.774
+0.848
3.7%
jan 1, 2010
21.47
-2.303
-9.69%
jan 1, 2011
19.405
-2.065
-9.62%
jan 1, 2012
20.002
+0.597
3.08%
jan 1, 2013
19.376
-0.626
-3.13%
jan 1, 2014
18.524
-0.852
-4.4%
jan 1, 2015
19.903
+1.379
7.44%
Ranking of countries by current statistics by years


Comments: