29
/
en
AIzaSyAYiBZKx7MnpbEhh9jyipgxe19OcubqV5w
April 1, 2024
57773
South Asia
SAS
false
2
1
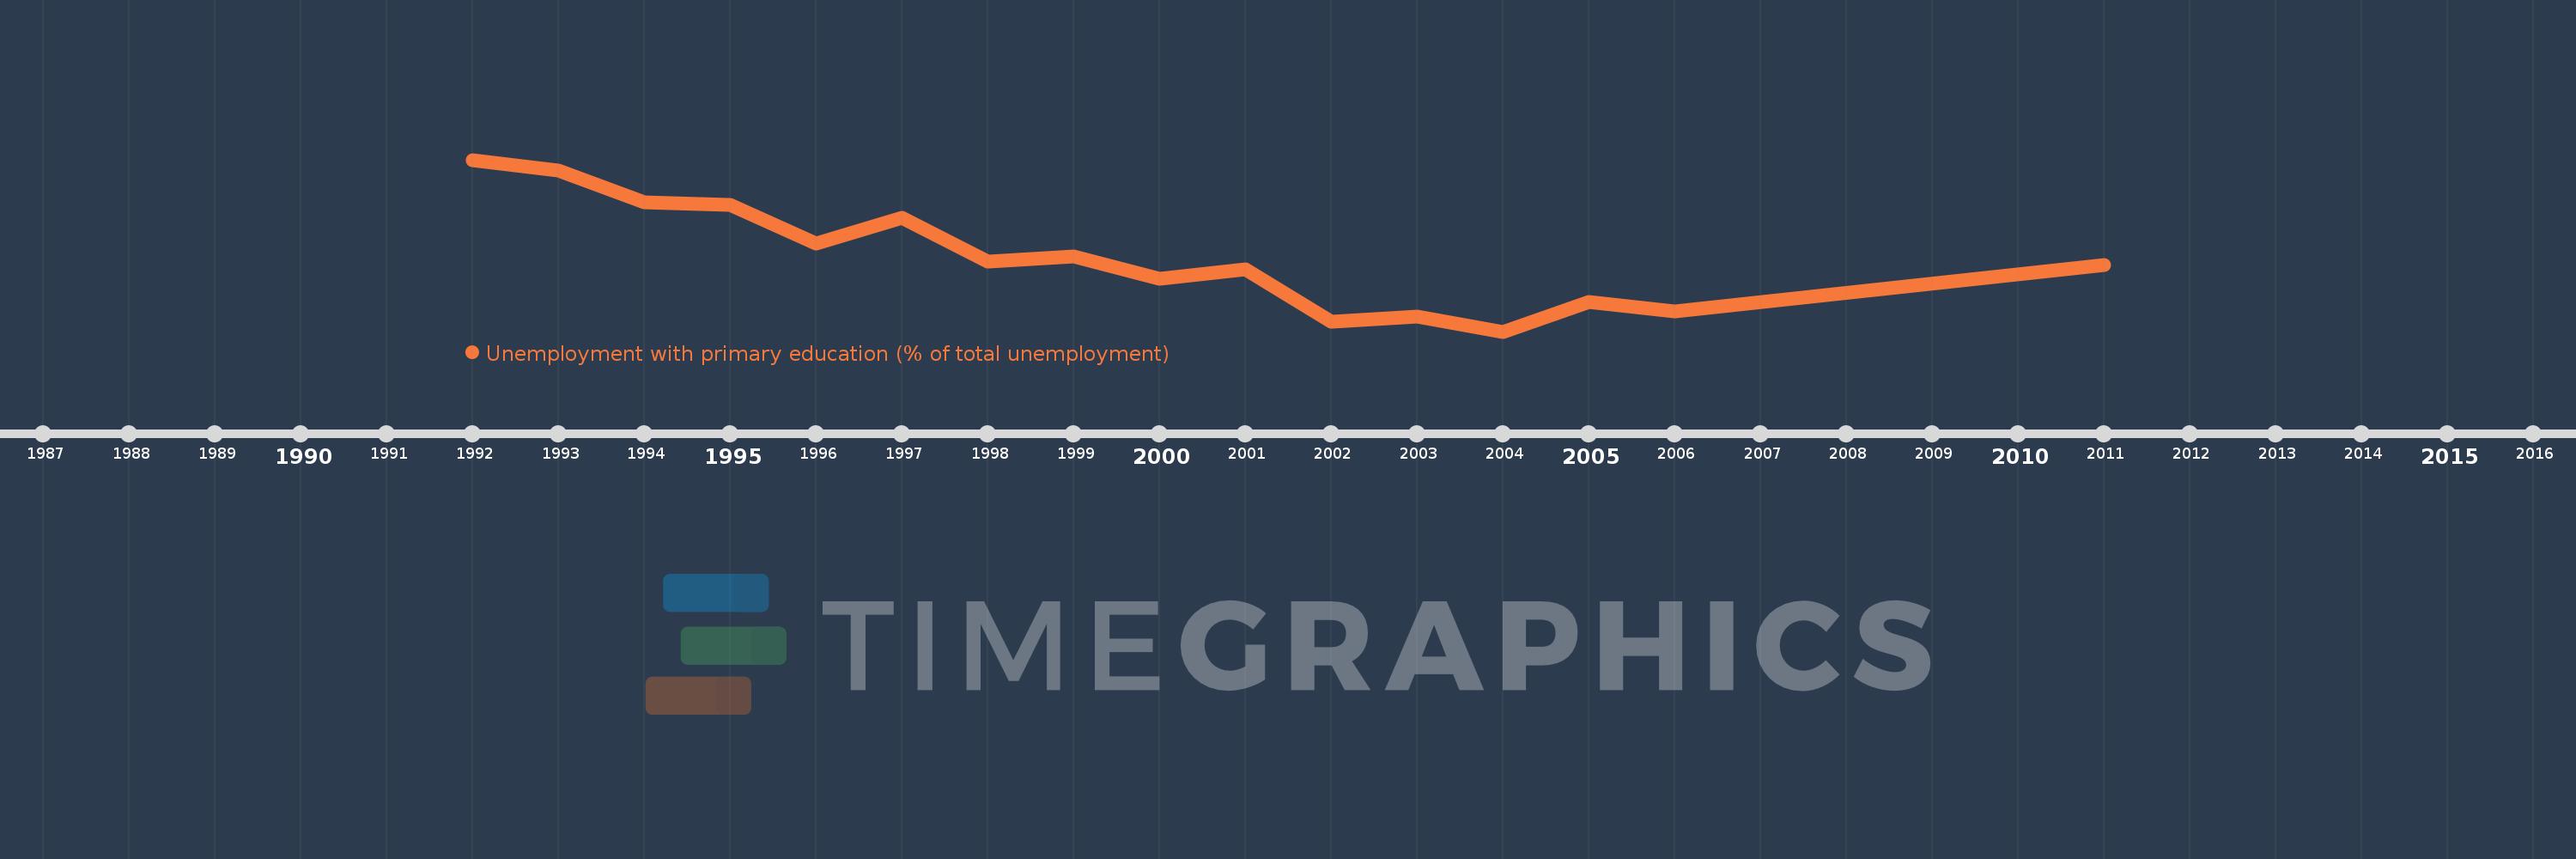
Unemployment with primary education (% of total unemployment)
2011,2006,2005,2004,2003,2002,2001,2000,1999,1998,1997,1996,1995,1994,1993,1992
This statistics in other country:
Timeline:
This timeline shows a graph from 1992 to 2011 of South Asia. No data until 1991. Number of actual observations by date: 16.
Source name:
World Development Indicators
Source organization:
International Labour Organization, Key Indicators of the Labour Market database.
Categories, topics:
Social Protection & Labor
Last updated:
apr 23, 2017
Indicators value changes by year
At the date of observation
Value
Absolute change
Change from previous value
jan 1, 1992
38.2
+38.2
0.0%
jan 1, 1993
37.4
-0.8
-2.09%
jan 1, 1994
34.9
-2.5
-6.68%
jan 1, 1995
34.7
-0.2
-0.57%
jan 1, 1996
31.713
-2.987
-8.61%
jan 1, 1997
33.716
+2.003
6.31%
jan 1, 1998
30.3
-3.416
-10.13%
jan 1, 1999
30.7
+0.4
1.32%
jan 1, 2000
29.0
-1.7
-5.54%
jan 1, 2001
29.712
+0.712
2.45%
jan 1, 2002
25.703
-4.009
-13.49%
jan 1, 2003
26.094
+0.391
1.52%
jan 1, 2004
24.92
-1.174
-4.5%
jan 1, 2005
27.204
+2.284
9.17%
jan 1, 2006
26.495
-0.709
-2.61%
jan 1, 2011
30.08
+3.585
13.53%
Ranking of countries by current statistics by years


Comments: