29
/
en
AIzaSyAYiBZKx7MnpbEhh9jyipgxe19OcubqV5w
April 1, 2024
263112
Thailand
THA
true
2
1
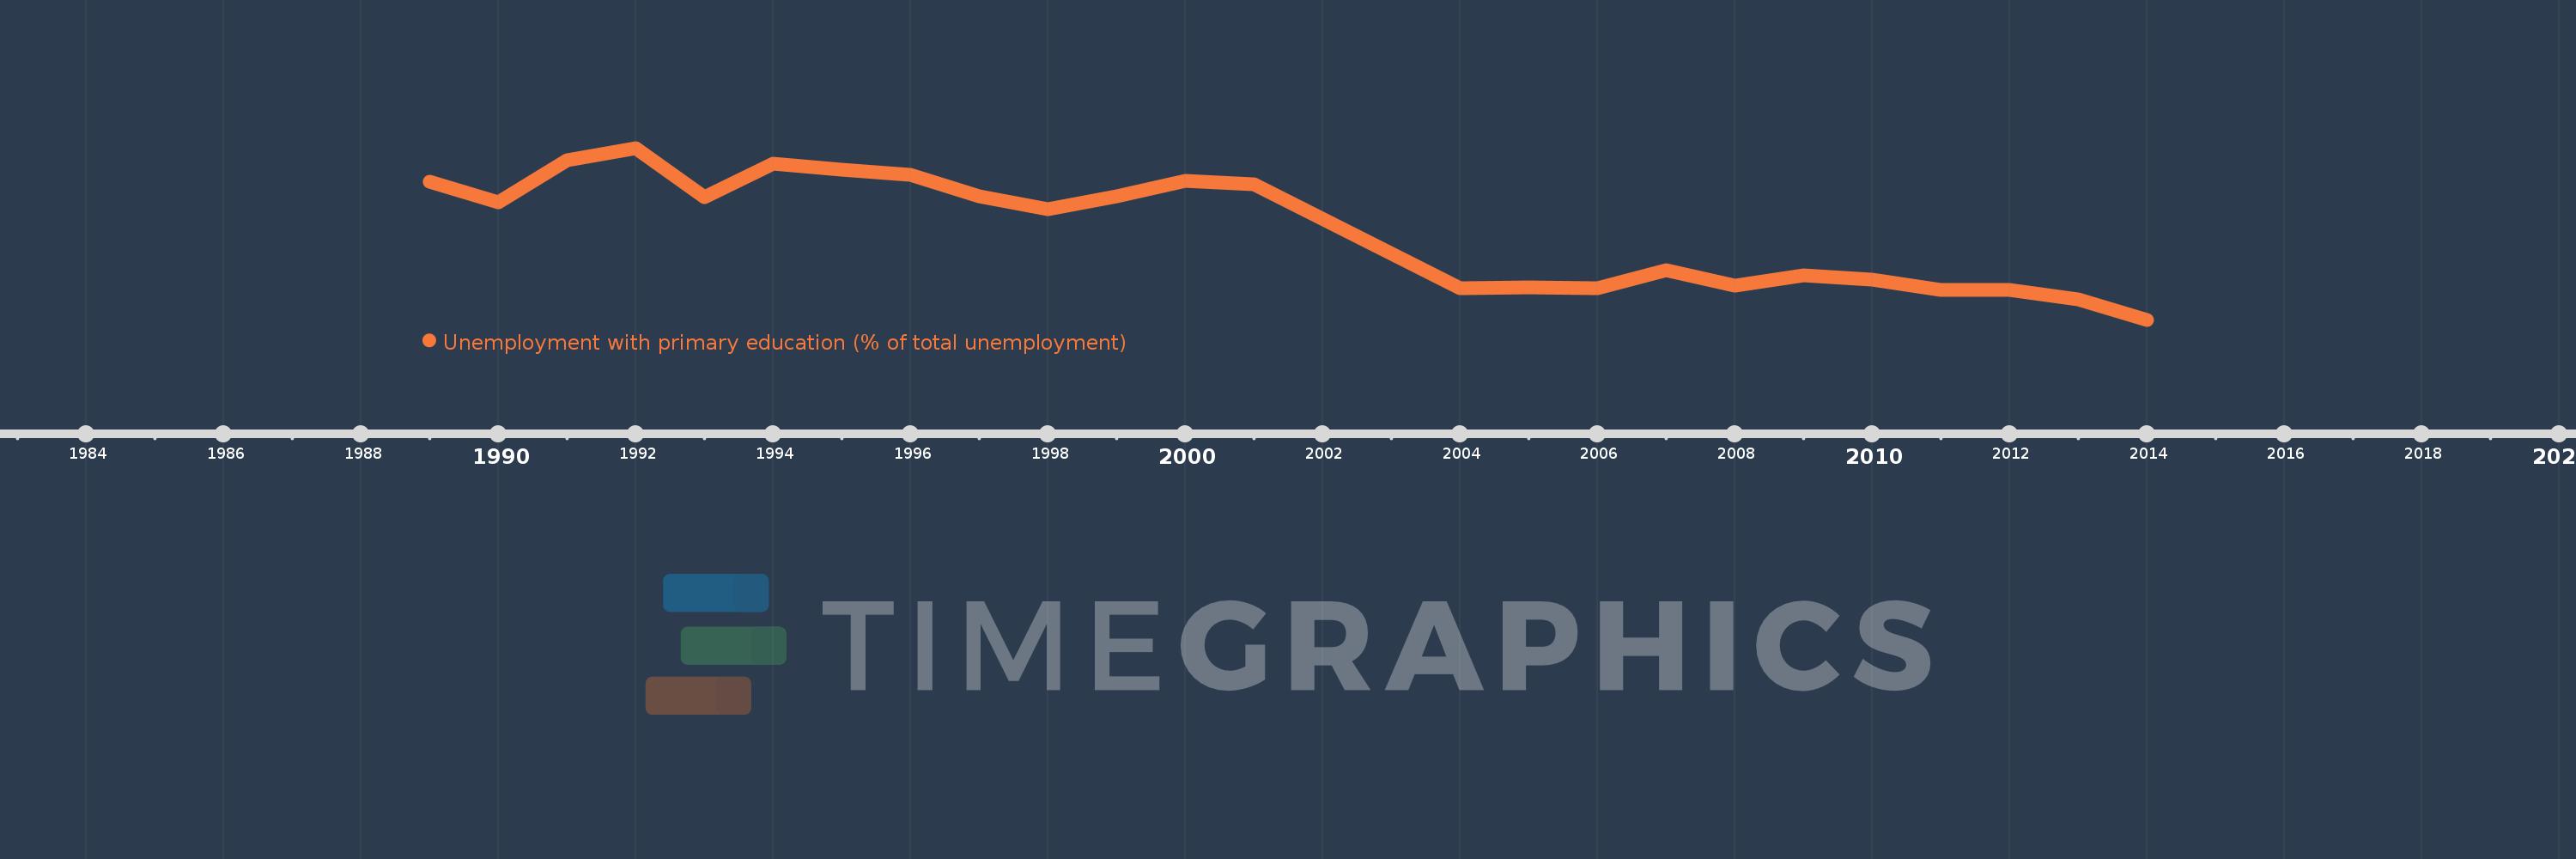
Unemployment with primary education (% of total unemployment)
2014,2013,2012,2011,2010,2009,2008,2007,2006,2005,2004,2001,2000,1999,1998,1997,1996,1995,1994,1993,1992,1991,1990,1989
This statistics in other country:
Timeline:
This timeline shows a graph from 1989 to 2014 of Thailand. No data until 1988. Number of actual observations by date: 24.
Source name:
World Development Indicators
Source organization:
International Labour Organization, Key Indicators of the Labour Market database.
Categories, topics:
Social Protection & Labor
Last updated:
apr 23, 2017
Indicators value changes by year
At the date of observation
Value
Absolute change
Change from previous value
jan 1, 1989
71.4
+71.4
0.0%
jan 1, 1990
65.1
-6.3
-8.82%
jan 1, 1991
77.6
+12.5
19.2%
jan 1, 1992
81.3
+3.7
4.77%
jan 1, 1993
66.8
-14.5
-17.84%
jan 1, 1994
76.7
+9.9
14.82%
jan 1, 1995
74.8
-1.9
-2.48%
jan 1, 1996
73.3
-1.5
-2.01%
jan 1, 1997
66.9
-6.4
-8.73%
jan 1, 1998
63.3
-3.6
-5.38%
jan 1, 1999
67.0
+3.7
5.85%
jan 1, 2000
71.6
+4.6
6.87%
jan 1, 2001
70.6
-1.0
-1.4%
jan 1, 2004
39.9
-30.7
-43.48%
jan 1, 2005
40.0
+0.1
0.25%
jan 1, 2006
39.7
-0.3
-0.75%
jan 1, 2007
45.2
+5.5
13.85%
jan 1, 2008
40.5
-4.7
-10.4%
jan 1, 2009
43.6
+3.1
7.65%
jan 1, 2010
42.4
-1.2
-2.75%
jan 1, 2011
39.2
-3.2
-7.55%
jan 1, 2012
39.4
+0.2
0.51%
jan 1, 2013
36.5
-2.9
-7.36%
jan 1, 2014
30.5
-6.0
-16.44%
Ranking of countries by current statistics by years


Comments: