29
/
en
AIzaSyAYiBZKx7MnpbEhh9jyipgxe19OcubqV5w
April 1, 2024
43109
Latin America & Caribbean (excluding high income)
LAC
false
2
1
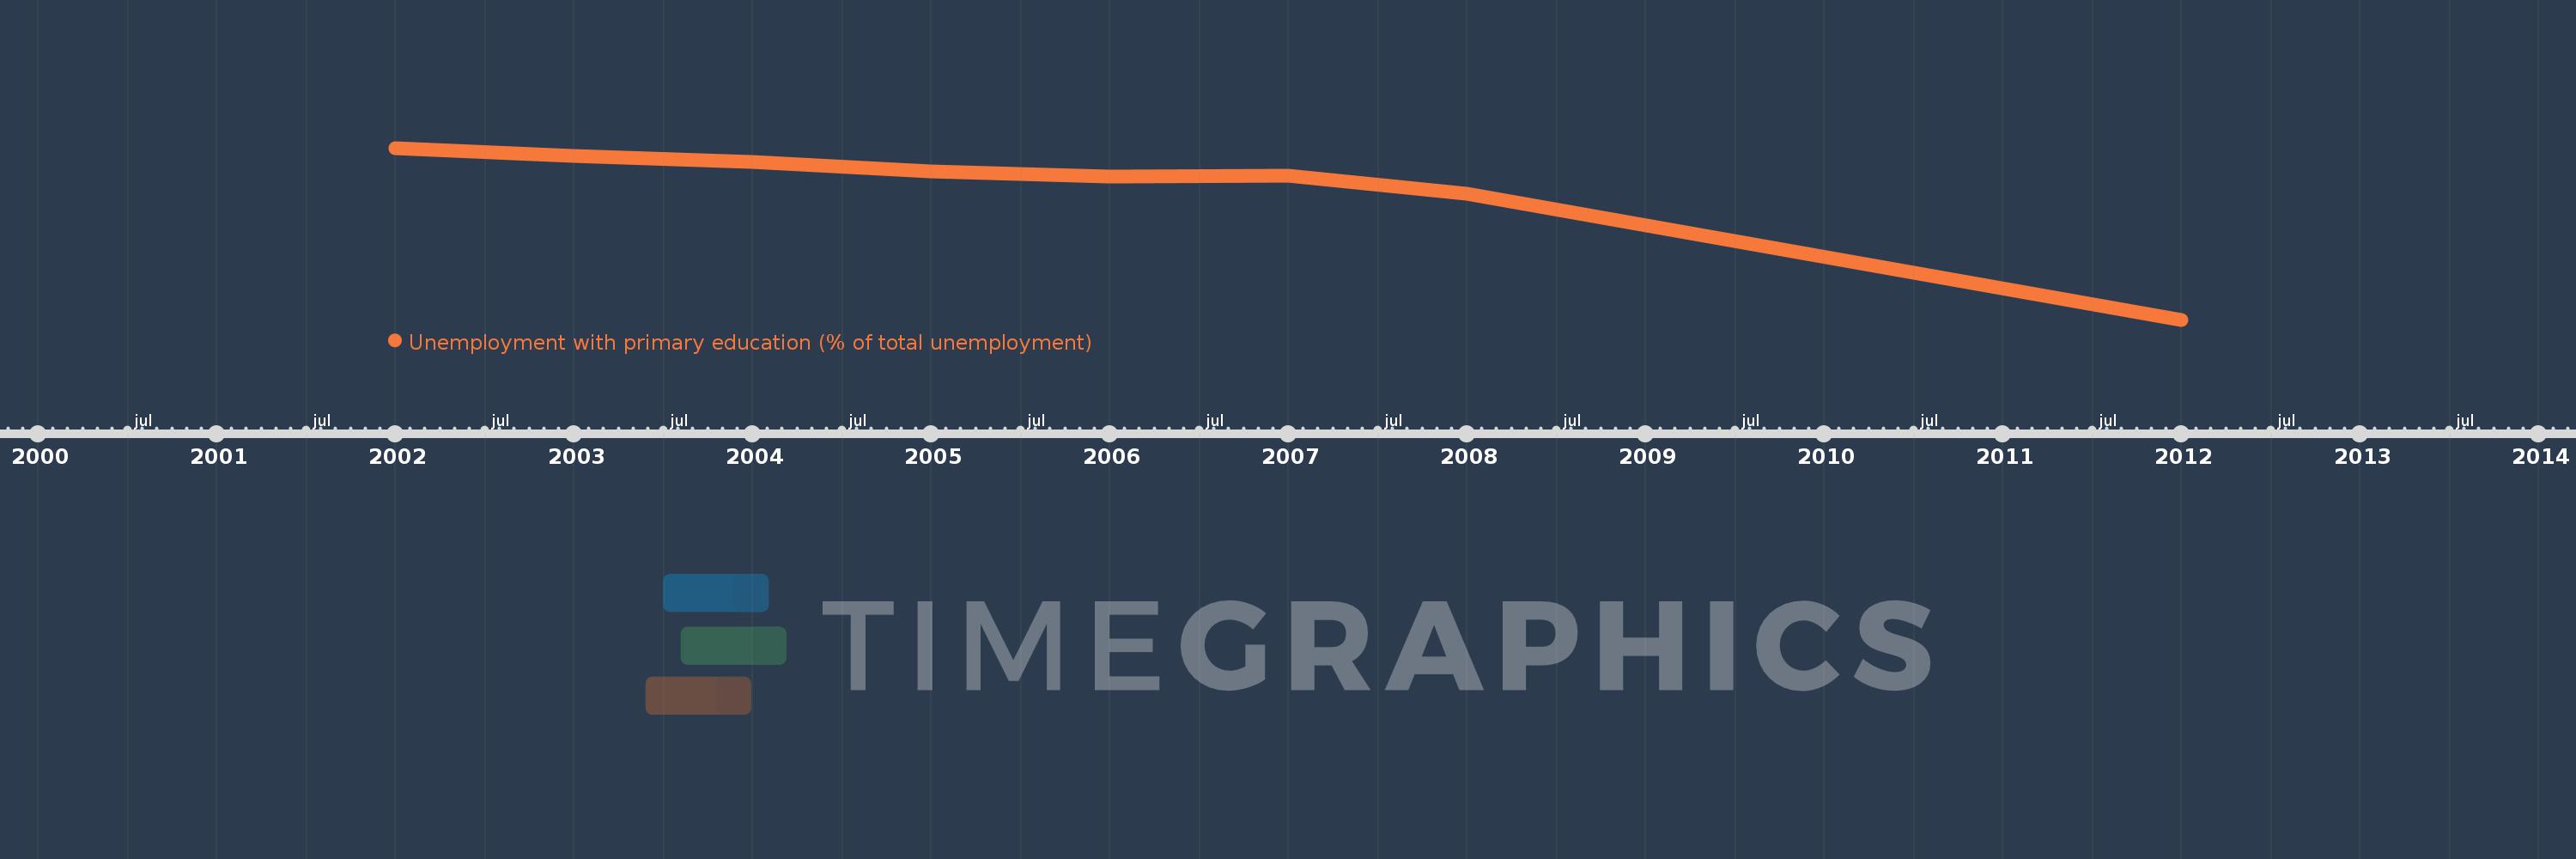
Unemployment with primary education (% of total unemployment)
2012,2008,2007,2006,2005,2004,2003,2002
This statistics in other country:
Timeline:
This timeline shows a graph from 2002 to 2012 of Latin America & Caribbean (excluding high income). No data until 2001. Number of actual observations by date: 8.
Source name:
World Development Indicators
Source organization:
International Labour Organization, Key Indicators of the Labour Market database.
Categories, topics:
Social Protection & Labor
Last updated:
apr 23, 2017
Indicators value changes by year
Maximum:
46.638
jan 1, 2002
At the date of observation
Value
Absolute change
Change from previous value
jan 1, 2002
46.638
+46.638
0.0%
jan 1, 2003
45.722
-0.916
-1.96%
jan 1, 2004
45.073
-0.649
-1.42%
jan 1, 2005
44.035
-1.038
-2.3%
jan 1, 2006
43.489
-0.546
-1.24%
jan 1, 2007
43.582
+0.092
0.21%
jan 1, 2008
41.588
-1.994
-4.58%
jan 1, 2012
27.72
-13.868
-33.35%
Ranking of countries by current statistics by years


Comments: