29
/
en
AIzaSyAYiBZKx7MnpbEhh9jyipgxe19OcubqV5w
April 1, 2024
267455
Trinidad and Tobago
TTO
true
2
1
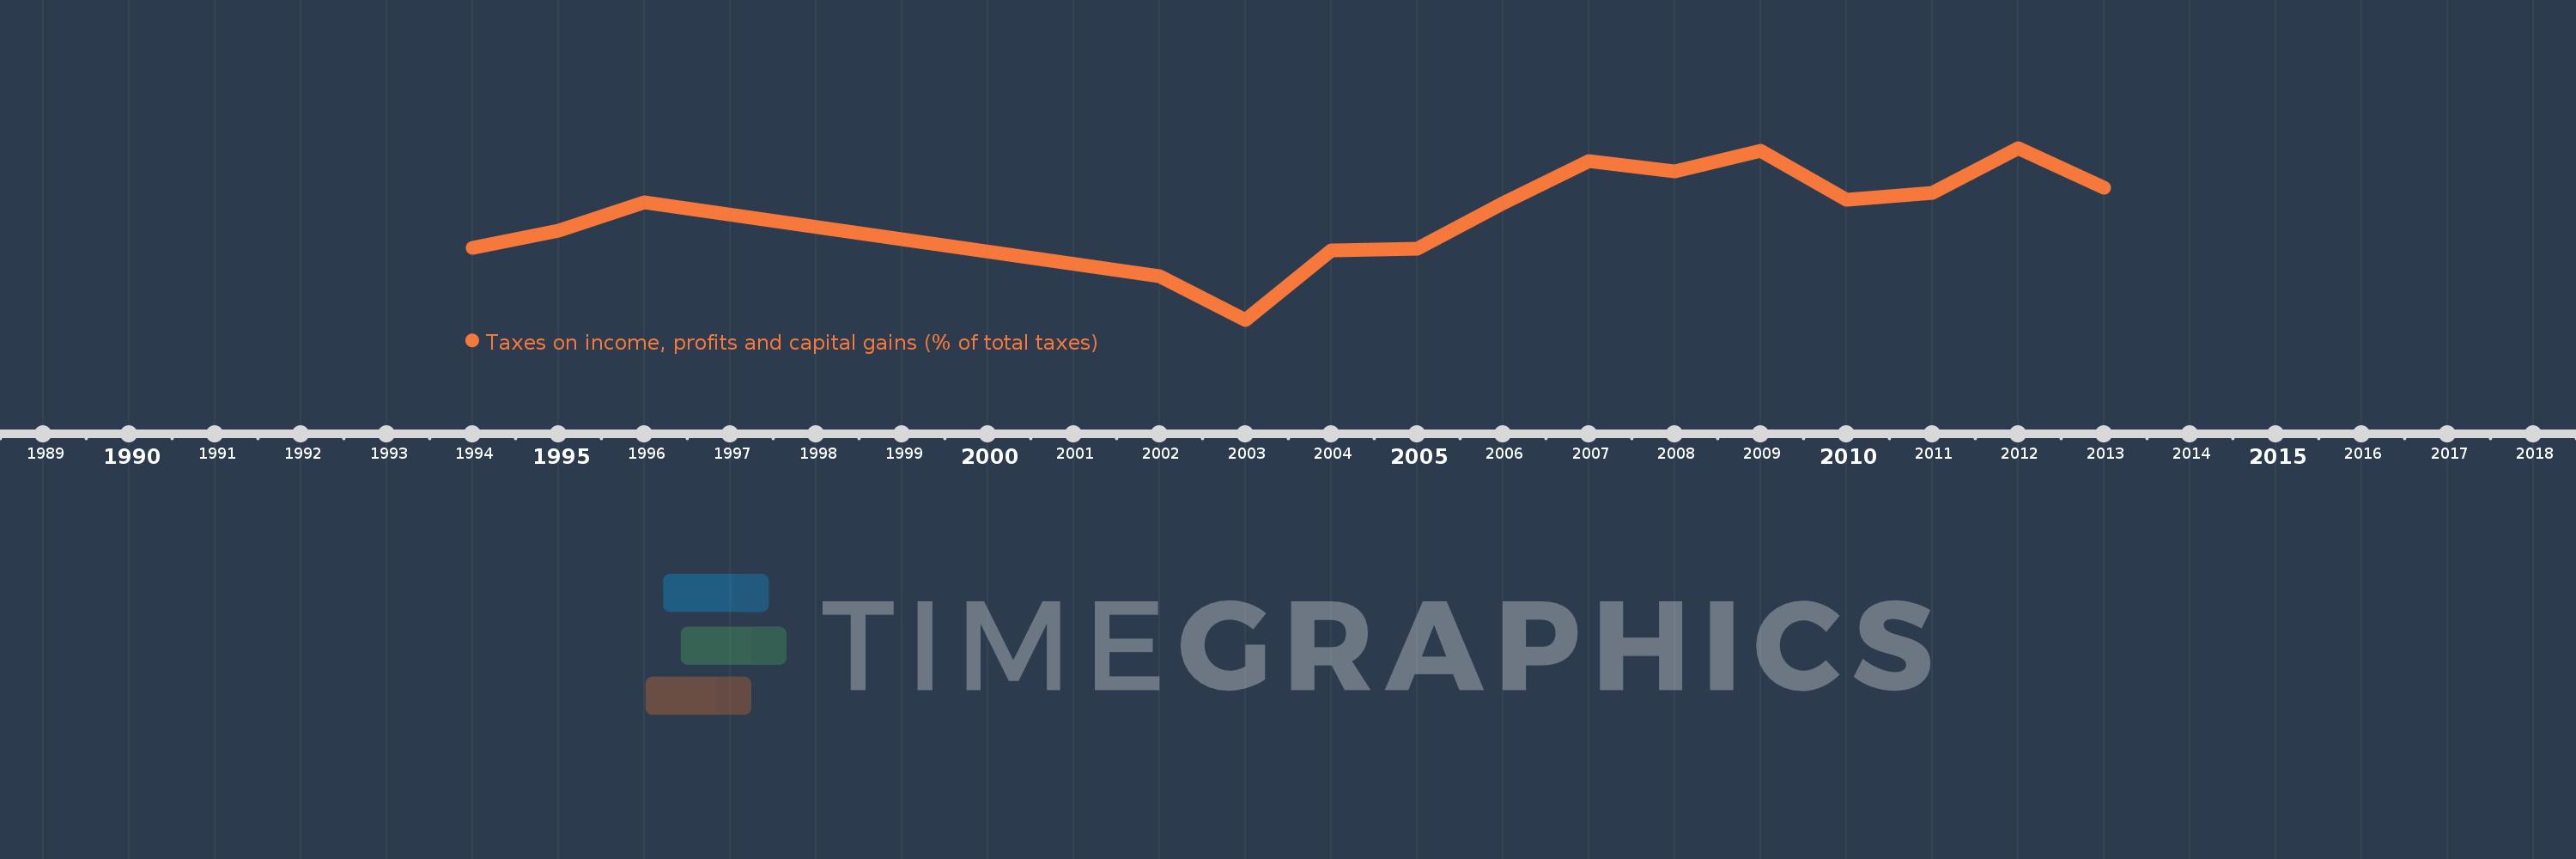
Taxes on income, profits and capital gains (% of total taxes)
2013,2012,2011,2010,2009,2008,2007,2006,2005,2004,2003,2002,1996,1995,1994
This statistics in other country:
AfghanistanAlbaniaAlgeriaAngolaAntigua and BarbudaArgentinaArmeniaAustraliaAustriaAzerbaijanBahrainBangladeshBarbadosBelarusBelgiumBelizeBeninBhutanBoliviaBosnia and HerzegovinaBotswanaBrazilBulgariaBurkina FasoBurundiCabo VerdeCambodiaCanadaCentral African RepublicChileChinaColombiaCongo, Dem. Rep.Congo, Rep.Costa RicaCote d'IvoireCroatiaCyprusCzech RepublicDenmarkDominicaDominican RepublicEgypt, Arab Rep.El SalvadorEquatorial GuineaEstoniaEthiopiaFijiFinlandFranceGambia, TheGeorgiaGermanyGhanaGreeceGrenadaGuatemalaHondurasHong Kong SAR, ChinaHungaryIcelandIndiaIndonesiaIran, Islamic Rep.IraqIrelandIsraelItalyJamaicaJapanJordanKazakhstanKenyaKiribatiKorea, Rep.KuwaitKyrgyz RepublicLao PDRLatviaLebanonLesothoLiberiaLithuaniaLuxembourgMacao SAR, ChinaMacedonia, FYRMadagascarMalawiMalaysiaMaldivesMaliMaltaMauritiusMexicoMicronesia, Fed. Sts.MoldovaMongoliaMoroccoMozambiqueMyanmarNamibiaNepalNetherlandsNew ZealandNicaraguaNigeriaNorwayOmanPakistanPanamaPapua New GuineaParaguayPeruPhilippinesPolandPortugalQatarRomaniaRussian FederationRwandaSamoaSan MarinoSao Tome and PrincipeSenegalSerbiaSeychellesSierra LeoneSingaporeSlovak RepublicSloveniaSolomon IslandsSouth AfricaSpainSri LankaSt. Kitts and NevisSt. LuciaSurinameSwazilandSwedenSwitzerlandSyrian Arab RepublicTajikistanTanzaniaThailandTimor-LesteTogoTrinidad and TobagoTunisiaTurkeyUgandaUkraineUnited KingdomUnited StatesUruguayVenezuela, RBVietnamWest Bank and GazaYemen, Rep.ZambiaZimbabwe Timeline:
This timeline shows a graph from 1994 to 2013 of Trinidad and Tobago. No data until 1993. Number of actual observations by date: 15.
Source name:
World Development Indicators
Source organization:
International Monetary Fund, Government Finance Statistics Yearbook and data files.
Categories, topics:
Public Sector
Last updated:
apr 23, 2017
Indicators value changes by year
Minimum:
33.963
jan 1, 2003
Maximum:
72.309
jan 1, 2012
At the date of observation
Value
Absolute change
Change from previous value
jan 1, 1994
50.011
+50.011
0.0%
jan 1, 1995
53.827
+3.815
7.63%
jan 1, 1996
60.201
+6.374
11.84%
jan 1, 2002
43.742
-16.458
-27.34%
jan 1, 2003
33.963
-9.78
-22.36%
jan 1, 2004
49.405
+15.443
45.47%
jan 1, 2005
49.771
+0.366
0.74%
jan 1, 2006
60.013
+10.241
20.58%
jan 1, 2007
69.29
+9.277
15.46%
jan 1, 2008
67.104
-2.185
-3.15%
jan 1, 2009
71.683
+4.579
6.82%
jan 1, 2010
60.702
-10.981
-15.32%
jan 1, 2011
62.229
+1.527
2.51%
jan 1, 2012
72.309
+10.08
16.2%
jan 1, 2013
63.51
-8.799
-12.17%
Ranking of countries by current statistics by years


Comments: